Archive for the ‘X-ray’ Category.
Jun 21st, 2010| 12:25 pm | Posted by chasc
mini-Workshop on Computational Astro-statistics: Challenges and Methods for Massive Astronomical Data
Aug 24-25, 2010
Phillips Auditorium, CfA,
60 Garden St., Cambridge, MA 02138
URL: http://hea-www.harvard.edu/AstroStat/CAS2010
Continue reading ‘mini-Workshop on Computational AstroStatistics [announcement]’ »
Tags:
2010,
Announcement,
astronomical data,
astrostatistics,
Aug 2010,
August,
Computational,
workshop Category:
Astro,
CHASC,
gamma-ray,
Methods,
News,
Optical,
Stat,
X-ray |
Comment
Feb 11th, 2010| 02:04 pm | Posted by vlk
The Solar Dynamics Observatory, which promises a flood of data on the Sun, was launched today from Cape Kennedy.
Oct 1st, 2009| 09:11 pm | Posted by hlee
So far, I didn’t complain much related to my “statistician learning astronomy” experience. Instead, I’ve been trying to emphasize how fascinating it is. I hope that more statisticians can join this adventure when statisticians’ insights are on demand more than ever. However, this positivity seems not working so far. In two years of this slog’s life, there’s no posting by a statistician, except one about BEHR. Statisticians are busy and well distracted by other fields with more tangible data sets. Or compared to other fields, too many obstacles and too high barriers exist in astronomy for statisticians to participate. I’d like to talk about these challenges from my ends.[] Continue reading ‘data analysis system and its documentation’ »
Tags:
ARF,
calibration,
ciao,
cultural shock,
data analysis system,
documentation,
FITS,
obstacles,
pha,
PSF,
RMF,
Sherpa,
standard procedure,
Tutorial,
unification,
validation,
XSPEC Category:
Astro,
Cross-Cultural,
Data Processing,
High-Energy,
Misc,
Quotes,
X-ray |
Comment
Jul 29th, 2009| 01:02 am | Posted by hlee
Speaking of XAtlas from my previous post I tried another visualization tool called Parallel Coordinates on these Capella observations and two stars with multiple observations (AL Lac and IM Peg). As discussed in [MADS] Chernoff face, full description of the catalog is found from XAtlas website. The reason for choosing these stars is that among low mass stars, next to Capella (I showed 16), IM PEG (HD 21648, 8 times), and AR Lac (although different phases, 6 times) are most frequently observed. I was curious about which variation, within (statistical variation) and between (Capella, IM Peg, AL Lac), is dominant. How would they look like from the parametric space of High Resolution Grating Spectroscopy from Chandra? Continue reading ‘[MADS] Parallel Coordinates’ »
Tags:
Classification,
clustering,
display,
EDA,
eye catcher,
GGobi,
Inselberg,
parallel coordinates,
visualization Category:
Algorithms,
arXiv,
Cross-Cultural,
Data Processing,
High-Energy,
Jargon,
Methods,
Spectral,
X-ray |
3 Comments
Apr 2nd, 2009| 12:00 pm | Posted by hlee
I cannot remember when I first met Chernoff face but it hooked me up instantly. I always hoped for confronting multivariate data from astronomy applicable to this charming EDA method. Then, somewhat such eager faded, without realizing what’s happening. Tragically, this was mainly due to my absent mind. Continue reading ‘[MADS] Chernoff face’ »
Tags:
calibration,
Capella,
Chandra,
Chernoff face,
EDA,
line ratios,
MADS,
XAtlas Category:
Algorithms,
arXiv,
Astro,
Cross-Cultural,
Data Processing,
Jargon,
Methods,
Misc,
News,
Quotes,
Spectral,
Stars,
X-ray |
2 Comments
Mar 17th, 2009| 03:37 pm | Posted by hlee
I couldn’t believe my eyes when I saw 4754 degrees of freedom (d.f.) and chi-square test statistic 4859. I’ve often enough seen large degrees of freedom from journals in astronomy, several hundreds to a few thousands, but I never felt comfortable at these big numbers. Then with a great shock 4754 d.f. appeared. I must find out why I feel so bothered at these huge degrees of freedom. Continue reading ‘4754 d.f.’ »
Tags:
Binning,
chi-square,
chi-square minimization,
chi-square optimization,
chi-square statistic,
class,
degrees-of-freedom,
equiprobable,
goodness-of-fit test,
kernel density estimation Category:
Bad AstroStat,
Fitting,
High-Energy,
Methods,
Spectral,
X-ray |
2 Comments
Nov 17th, 2008| 01:39 pm | Posted by hlee
The full description is given http://cxc.harvard.edu/ciao3.4/ahelp/bayes.html about “bayes” under sherpa/ciao[]. Some sentences kept bothering me and here’s my account for the reason given outside of quotes. Continue reading ‘It bothers me.’ »
Tags:
bayes,
ciao,
ML,
Sherpa Category:
Algorithms,
Astro,
Cross-Cultural,
Data Processing,
Fitting,
High-Energy,
Jargon,
Languages,
Methods,
Spectral,
Uncertainty,
X-ray |
4 Comments
Oct 23rd, 2008| 12:25 pm | Posted by vlk
Aug 27th, 2008| 07:50 am | Posted by vlk
UChicago, my alma mater, is doing alright for itself in the spacecraft naming business.
First there was Edwin Hubble (S.B. 1910, Ph.D. 1917).
Then came Arthur Compton (the “MetLab”).
Followed by Subramanya Chandrasekhar (Morton D. Hull Distinguished Service Professor of Theoretical Astrophysics).
And now, Enrico Fermi.
Tags:
CGRO,
Chandra,
Compton,
CXO,
Fermi,
GLAST,
HST,
Hubble,
observatory,
UChicago,
University of Chicago Category:
Astro,
gamma-ray,
High-Energy,
News,
Optical,
X-ray |
Comment
Aug 13th, 2008| 01:00 pm | Posted by vlk
Differential Emission Measures (DEMs) are a summary of the temperature structure of the outer atmospheres (aka coronae) of stars, and are usually derived from a select subset of line fluxes. They are notoriously difficult to estimate. Very few algorithms even bother to calculate error envelopes on them. They are also subject to numerous systematic uncertainties which can play havoc with proper interpretation. But they are nevertheless extremely useful since they allow changes in coronal structures to be easily discerned, and observations with one instrument can be used to derive these DEMs and these can then be used to predict what is observable with some other instrument. Continue reading ‘Differential Emission Measure [Eqn]’ »
Tags:
DEM,
Differential Emission Measure,
EotW,
Equation,
Equation of the Week,
stellar coronae Category:
Astro,
High-Energy,
Jargon,
Spectral,
Stars,
X-ray |
2 Comments
Jul 30th, 2008| 01:00 pm | Posted by vlk
I have noticed that our statistician collaborators are often confused by our units. (Not a surprise; I, too, am constantly confused by our units.) One of the biggest culprits is the unit of energy, [keV], Continue reading ‘keV vs keV [Eqn]’ »
Tags:
Angstrom,
Boltzmann,
EotW,
Equation,
Equation of the Week,
erg,
Kelvin,
keV,
Planck,
temperature,
units,
wavelength Category:
Astro,
High-Energy,
Jargon,
X-ray |
1 Comment
May 19th, 2008| 10:42 am | Posted by hlee
There’s no particular opening remark this week. Only I have profound curiosity about jackknife tests in [astro-ph:0805.1994]. Including this paper, a few deserve separate discussions from a statistical point of view that shall be posted. Continue reading ‘[ArXiv] 2nd week, May 2008’ »
Tags:
bimodality,
bootstrap,
calibration uncertainty,
CF,
Classification,
CMB,
dip,
exoplanet,
Fisher matrix,
flare,
GL,
jackknife,
KS test,
marked point,
maximum likelihood,
MLE,
poisson point process,
spatial data,
XLF Category:
arXiv,
Frequentist,
Uncertainty,
X-ray |
Comment
Nov 6th, 2007| 05:47 pm | Posted by aneta
The chi2 bias can affect the results of the X-ray spectral fitting and it
can be demonstrated in a simple way. The described simulations can be done
in Sherpa or XSPEC, the two software packages that allow for simulating the X-ray
spectra using a function called “fakeit”.
Here I assume an absorbed power law model with the sets of 3 parameters
(absorption column, photon index, and normalization) to simulate Chandra X-ray
spectrum given the instrument calibration files (RMF/ARF) and the Poisson noise.
The resulting simulated X-ray spectrum contains the model predicted counts with
the Poisson noise. This spectrum is then fit with the absorbed power law model to get
the best fit parameter values for NH, photon index and normalization.
I simulate 1000 spectra and fit each of them using different statistics: chi2 data variance,
chi2 model variance and Cash/C-statistics.
The next step is to plot the simulated distributions of the parameters and compare them
to the assumed values for the simulations. The figure shows the distribution of the photon
index parameter obtain from the fit of the spectra generated for the assumed simulated value
of 1.267. The chi2 bias is evident in this analysis, while the
CSTAT and Cash statistics based on the likelihood behave well. chi2 model variance
underestimates the simulated value, chi2 data variance overestimates this parameter.
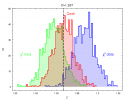
The plot shows the distribution of photon index parameters obtained by
fitting the simulated X-ray spectra with about 60000 counts and using the
three different statistics: chi2 with the model variance, chi2 with
data variance and C-statistics (Cash). The assumed value in the
simulations 1.267 is marked with the solid line.
Oct 21st, 2007| 03:59 pm | Posted by vlk
wavdetect is a wavelet-based source detection algorithm that is in wide use in X-ray data analysis, in particular to find sources in Chandra images. It came out of the Chicago “Beta Site” of the AXAF Science Center (what CXC used to be called before launch). Despite the fancy name, and the complicated mathematics and the devilish details, it is really not much more than a generalization of earlier local cell detect, where a local background is estimated around a putative source and the question is asked, is whatever signal that is being seen in this pixel significantly higher than expected? However, unlike previous methods that used a flux measurement as the criterion for detection (e.g., using signal-to-noise ratios as proxy for significance threshold), it tests the hypothesis that the observed signal can be obtained as a fluctuation from the background. Continue reading ‘The power of wavdetect’ »
Tags:
AXAF,
ChaMP,
Chandra,
ciao,
Power,
source detection,
Type II error,
wavdetect,
wavelet Category:
Algorithms,
Imaging,
X-ray |
1 Comment
Sep 20th, 2007| 12:26 pm | Posted by vlk
[arXiv:0709.3093v1] Short Timescale Coronal Variability in Capella (Kashyap & Posson-Brown)
We recently submitted that paper to AJ, and rather ironically, I did the analysis during the same time frame as this discussion was going on, about how astronomers cannot rely on repeating observations. Ironic because the result reported there hinges on the existence of small, but persistent signal that is found in repeated observations of the same source. Doubly ironic in fact, in that just as we were backing and forthing about cultural differences I seemed to have gone and done something completely contrary to my heritage! Continue reading ‘Betraying your heritage’ »
Tags:
arXiv,
Capella,
Cross-Cultural,
HRC,
overdispersion,
repeatability,
significance,
variability,
X-ray Category:
arXiv,
Astro,
Cross-Cultural,
Quotes,
Stars,
Stat,
Timing,
X-ray |
Comment
