Archive for the ‘Spectral’ Category.
Jan 30th, 2008| 02:33 am | Posted by hlee
Astronomers have developed their ways of processing signals almost independent to but sometimes collaboratively with engineers, although the fundamental of signal processing is same: extracting information. Doubtlessly, these two parallel roads of astronomers’ and engineers’ have been pointing opposite directions: one toward the sky and the other to the earth. Nevertheless, without an intensive argument, we could say that somewhat statistics has played the medium of signal processing for both scientists and engineers. This particular issue of IEEE signal processing magazine may shed lights for astronomers interested in signal processing and statistics outside the astronomical society.
IEEE Signal Processing Magazine Jul. 2007 Vol 24 Issue 4: Bootstrap methods in signal processing
This link will show the table of contents and provide links to articles; however, the access to papers requires IEEE Xplore subscription via libraries or individual IEEE memberships). Here, I’d like to attempt to introduce some articles and tutorials.
Continue reading ‘Signal Processing and Bootstrap’ »
Tags:
bootstrap,
compressive sensing,
confidence interval,
GLM,
IEEE,
jacknife,
machine learning,
multitaper estimate,
particle filter,
signal processing,
statistical inference,
Tutorial,
wavelet Category:
Algorithms,
arXiv,
Bayesian,
Cross-Cultural,
Fitting,
Frequentist,
MC,
MCMC,
Methods,
Misc,
Spectral,
Stat,
Uncertainty |
Comment
Jan 21st, 2008| 03:33 pm | Posted by vlk
One of the big problems that has come up in recent years is in how to represent the uncertainty in certain estimates. Astronomers usually present errors as +-stddev on the quantities of interest, but that presupposes that the errors are uncorrelated. But suppose you are estimating a multi-dimensional set of parameters that may have large correlations amongst themselves? One such case is that of Differential Emission Measures (DEM), where the “quantity of emission” from a plasma (loosely, how much stuff there is available to emit — it is the product of the volume and the densities of electrons and H) is estimated for different temperatures. See the plots at the PoA DEM tutorial for examples of how we are currently trying to visualize the error bars. Another example is the correlated systematic uncertainties in effective areas (Drake et al., 2005, Chandra Cal Workshop). This is not dissimilar to the problem of determining the significance of a “feature” in an image (Connors, A. & van Dyk, D.A., 2007, SCMA IV). Continue reading ‘Dance of the Errors’ »
Tags:
animated,
David Garcia-Alvarez,
DEM,
error bands,
error bars,
flux,
MCMC,
O VII,
O VIII,
PINTofALE,
question for statisticians Category:
Algorithms,
Astro,
Data Processing,
Jargon,
MCMC,
Spectral,
Stars,
Uncertainty |
2 Comments
Nov 6th, 2007| 05:47 pm | Posted by aneta
The chi2 bias can affect the results of the X-ray spectral fitting and it
can be demonstrated in a simple way. The described simulations can be done
in Sherpa or XSPEC, the two software packages that allow for simulating the X-ray
spectra using a function called “fakeit”.
Here I assume an absorbed power law model with the sets of 3 parameters
(absorption column, photon index, and normalization) to simulate Chandra X-ray
spectrum given the instrument calibration files (RMF/ARF) and the Poisson noise.
The resulting simulated X-ray spectrum contains the model predicted counts with
the Poisson noise. This spectrum is then fit with the absorbed power law model to get
the best fit parameter values for NH, photon index and normalization.
I simulate 1000 spectra and fit each of them using different statistics: chi2 data variance,
chi2 model variance and Cash/C-statistics.
The next step is to plot the simulated distributions of the parameters and compare them
to the assumed values for the simulations. The figure shows the distribution of the photon
index parameter obtain from the fit of the spectra generated for the assumed simulated value
of 1.267. The chi2 bias is evident in this analysis, while the
CSTAT and Cash statistics based on the likelihood behave well. chi2 model variance
underestimates the simulated value, chi2 data variance overestimates this parameter.
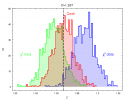
The plot shows the distribution of photon index parameters obtained by
fitting the simulated X-ray spectra with about 60000 counts and using the
three different statistics: chi2 with the model variance, chi2 with
data variance and C-statistics (Cash). The assumed value in the
simulations 1.267 is marked with the solid line.
Sep 7th, 2007| 02:02 am | Posted by hlee
From arxiv/math.st: 0708.0499v1
Inference for mixtures of symmetric distributions by Hunter, Wang, and Hettmansperger, Annals of Statistics, 2007, Vol.35(1), pp.224-251.
Continue reading ‘[ArXiv] Identifiability and mixtures of distributions, Aug. 3, 2007’ »
Aug 14th, 2007| 10:17 pm | Posted by hlee
During the International X-ray Summer School, as a project presentation, I tried to explain the inadequate practice of χ^2 statistics in astronomy. If your best fit is biased (any misidentification of a model easily causes such bias), do not use χ^2 statistics to get 1σ error for the 68% chance of capturing the true parameter.
Later, I decided to do further investigation on that subject and this paper came along: Astrostatistics: Goodness-of-Fit and All That! by Babu and Feigelson.
Continue reading ‘Astrostatistics: Goodness-of-Fit and All That!’ »
Tags:
Anderson-Darling,
Babu,
best-fit,
bias,
bootstrap,
chi-square,
Cramer-von Mises,
Feigelson,
Kolmogorov-Smirnoff,
Kullback-Leibler distance,
nonparametric,
parametric,
resampling Category:
Algorithms,
arXiv,
Astro,
Fitting,
High-Energy,
Methods,
Spectral,
Stat |
7 Comments
Aug 5th, 2007| 01:25 am | Posted by hlee
From arxiv/astro-ph:0707.1891v1
The Geneva-Copenhagen Survey of the Solar neighborhood II. New uvby calibrations and rediscussion of stellar ages, the G dwarf problem, age-metalicity diagram, and heating mechanisms of the disk by Holmberg, Nordstrom, and Andersen
Researchers, including scientists from CHASC, working on color magnitude diagrams to infer ages, metalicities, temperatures, and other physical quantities of stars and stellar clusters may find this paper useful.
Continue reading ‘[ArXiv] Geneva-Copenhagen Survey, July 13, 2007’ »
Tags:
age,
calibration,
CMD,
distance,
metalicity,
reddening,
relations,
star formation,
survey,
Uncertainty Category:
arXiv,
CHASC,
Fitting,
Spectral |
Comment
Jul 16th, 2007| 12:15 pm | Posted by hlee
From arxiv/astro-ph:0707.1900v1
The complete catalogue of gamma-ray bursts observed by the Wide Field Cameras on board BeppoSAX by Vetere, et.al.
This paper intend to publicize the largest data set of Gamma Ray Burst (GRB) X-ray afterglows (right curves after the event), which is available from http://www.asdc.asi.it. It is claimed to be a complete on-line catalog of GRB observed by two wide-Field Cameras on board BeppoSAX (Click for its Wiki) in the period of 1996-2002. It is comprised with 77 bursts and 56 GRBs with Xray light curves, covering the energy range 40-700keV. A brief introduction to the instrument, data reduction, and catalog description is given.
Tags:
afterglow,
BeppoSAX,
catalog,
GRB,
light curve Category:
arXiv,
Data Processing,
gamma-ray,
Objects,
Spectral,
Timing,
X-ray |
1 Comment
Jul 11th, 2007| 11:50 am | Posted by vlk
Hyunsook and I have preliminary findings (work done with the help of the X-Atlas group) on the efficacy of using spectral proxies to classify low-mass coronal sources, put up as a poster at the XGratings workshop. The workshop has a “poster haiku” session, where one may summarize a poster in a single transparency and speak on it for a couple of minutes. I cannot count syllables, so I wrote a limerick instead: Continue reading ‘Summarizing Coronal Spectra’ »
Tags:
2007,
dendrograms,
limerick,
PCA,
workshop,
X-Atlas,
XAtlas,
XGratings Category:
Astro,
News,
Quotes,
Spectral,
Stars,
X-ray |
Comment
Jul 2nd, 2007| 06:07 pm | Posted by hlee
From arXiv/astro-ph:0706.4484
Spectroscopic Surveys: Present by Yip. C. overviews recent spectroscopic sky surveys and spectral analysis techniques toward Virtual Observatories (VO). In addition that spectroscopic redshift measures increase like Moore’s law, the surveys tend to go deeper and aim completeness. Mainly elliptical galaxy formation has been studied due to more abundance compared to spirals and the galactic bimodality in color-color or color-magnitude diagrams is the result of the gas-rich mergers by blue mergers forming the red sequence. Principal component analysis has incorporated ratios of emission line-strengths for classifying Type-II AGN and star forming galaxies. Lyα identifies high z quasars and other spectral patterns over z reveal the history of the early universe and the characteristics of quasars. Also, the recent discovery of 10 satellites to the Milky Way is mentioned.
Continue reading ‘[ArXiv] Spectroscopic Survey, June 29, 2007’ »
Tags:
bimodality,
chi-square minimization,
Classification,
CMD,
Estimation,
machine learning,
massive data,
model based,
PCA,
spectral analysis,
spectroscopic,
survey,
VO Category:
arXiv,
Astro,
Bayesian,
Data Processing,
Fitting,
Frequentist,
Methods,
Spectral |
Comment
Jun 4th, 2007| 05:42 pm | Posted by vlk
Leccardi & Molendi (2007) have a paper in A&A (astro-ph/0705.4199) discussing the biases in parameter estimation when spectral fitting is confronted with low counts data. Not surprisingly, they find that the bias is higher for lower counts, for standard chisq compared to C-stat, for grouped data compared to ungrouped. Peter Freeman talked about something like this at the 2003 X-ray Astronomy School at Wallops Island (pdf1, pdf2), and no doubt part of the problem also has to do with the (un)reliability of the fitting process when the chisq surface gets complicated.
Anyway, they propose an empirical method to reduce the bias by computing the probability distribution functions (pdfs) for various simulations, and then averaging the pdfs in groups of 3. Seems to work, for reasons that escape me completely.
[Update: links to Peter's slides corrected]
Tags:
bias,
C-stat,
chi-square,
chisq,
Cstat,
Fitting,
parameter estimation,
Peter Freeman,
spectra Category:
arXiv,
Bad AstroStat,
Fitting,
Methods,
Spectral,
Stat |
1 Comment
May 29th, 2007| 06:12 pm | Posted by aconnors
Marty Weinberg , January 26, 2006, at the opening day of the Source and Feature Detection Working Group of the SAMSI 2006 Special Semester on Astrostatistics :
You can’t think about source detection and feature detection
without thinking of what you are going to use them for. The
ultimate inference problem and source/feature detection need to
go together.
May 25th, 2007| 04:30 pm | Posted by vlk
Despite some recent significant advances in Statistics and its applications to Astronomy (Cash 1976, Cash 1979, Gehrels 1984, Schmitt 1985, Isobe et al. 1986, van Dyk et al. 2001, Protassov et al. 2002, etc.), there still exist numerous problems and limitations in the standard statistical methodologies that are routinely applied to astrophysical data. For instance, the basic algorithms used in non-linear curve-fitting in spectra and images have remained unchanged since the 1960′s: the downhill simplex method of Nelder & Mead (1965) modified by Powell, and methods of steepest descent exemplified by Levenberg-Marquardt (Marquardt 1963). All non-linear curve-fitting programs currently in general use (Sherpa, XSPEC, MPFIT, PINTofALE, etc.) with the exception of Monte Carlo and MCMC methods are implementations based on these algorithms and thus share their limitations.
Continue reading ‘On the unreliability of fitting’ »
Tags:
best-fit,
chi-square,
chisq,
Fitting,
levenberg-marquardt,
MCMC,
steepest descent Category:
Bad AstroStat,
Data Processing,
Fitting,
Frequentist,
Methods,
Spectral,
Stat,
Uncertainty |
2 Comments
