The sherpa.plot module
A visualization interface to Sherpa
Classes
Confidence1D() |
|
IntervalProjection() |
|
IntervalUncertainty() |
|
Confidence2D() |
|
RegionProjection() |
|
RegionUncertainty() |
|
Contour() |
Base class for contour plots |
DataContour() |
Create contours of 2D data. |
PSFContour() |
Derived class for creating 2D PSF contours |
FitContour() |
Derived class for creating 2D combination data and model contours |
ModelContour() |
Derived class for creating 2D model contours |
RatioContour() |
Derived class for creating 2D ratio contours (data:model) |
ResidContour() |
Derived class for creating 2D residual contours (data-model) |
SourceContour() |
Derived class for creating 2D model contours |
Histogram() |
Base class for histogram plots |
Plot() |
Base class for line plots |
DataPlot() |
Create 1D plots of data values. |
PSFPlot() |
Derived class for creating 1D PSF kernel data plots |
FitPlot() |
Derived class for creating 1D combination data and model plots |
ModelPlot() |
Create 1D plots of model values. |
ChisqrPlot() |
Create plots of the chi-square value per point. |
ComponentModelPlot() |
|
DelchiPlot() |
Create plots of the delta-chi value per point. |
RatioPlot() |
Create plots of the ratio of data to model per point. |
ResidPlot() |
Create plots of the residuals (data - model) per point. |
SourcePlot() |
Create 1D plots of unconcolved model values. |
ComponentSourcePlot() |
|
SplitPlot([rows, cols]) |
Create multiple plots. |
JointPlot() |
|
Point() |
Base class for point plots |
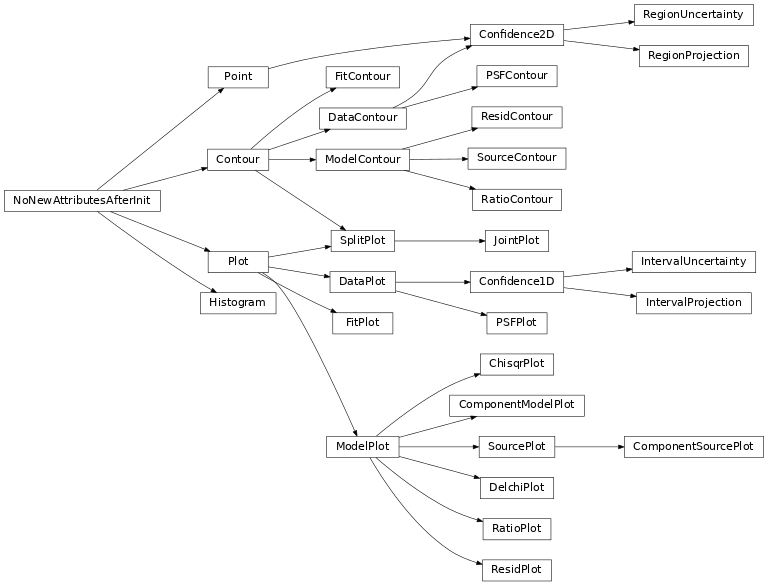
Class Inheritance Diagram