Poisson vs Gaussian
We astronomers are rather fond of approximating our counting statistics with Gaussian error distributions, and a lot of ink has been spilled justifying and/or denigrating this habit. But just how bad is the approximation anyway?
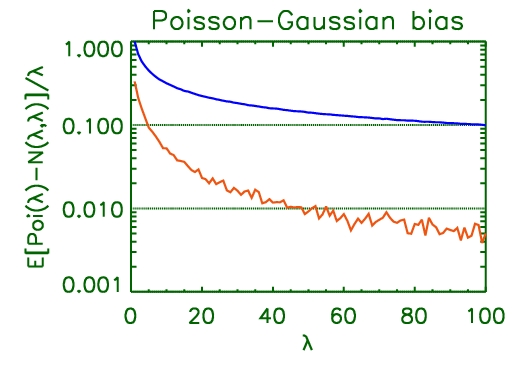
I ran a simple Monte Carlo based test to compute the expected bias between a Poisson sample and the “equivalent” Gaussian sample. The result is shown in the plot below.
The jagged red line is the fractional expected bias relative to the true intensity. The typical recommendation in high-energy astronomy is to bin up events until there are about 25 or so counts per bin. This leads to an average bias of about 2% in the estimate of the true intensity. The bias drops below 1% for counts >50. The smooth blue line is the reciprocal of the square-root of the intensity, reflecting the width of the Poisson distribution relative to the true intensity, and is given here only for illustrative purposes.
Poisson-Gaussian bias
Exemplar IDL code that can be used to generate this kind of plot is appended below:
nlam=100L & nsim=20000L

lam=indgen(nlam)+1 & sct=intarr(nlam,nsim) & scg=sct & dct=fltarr(nlam)

for i=0L,nlam-1L do sct[i,*]=randomu(seed,nsim,poisson=lam[i])

for i=0L,nlam-1L do scg[i,*]=randomn(seed,nsim)*sqrt(lam[i])+lam[i]

for i=0,nlam-1L do dct[i]=mean(sct[i,*]-scg[i,*])/(lam[i])

plot,lam,dct,/yl,yticklen=1,ygrid=1

oplot,lam,1./sqrt(lam)
hlee:
Upon reading it, I recall my post and the article therein, covering the topic in general: Coverage issues in exponential families. The authors, Brown, Cai,and DasGupta discussed biases.
Alot to be said related to binning, multinomial, approximation or converenge in order to use chi-square type test statistics and to compensate discreteness in Poisson; instead i’d rather put an irrelevant question. How many statisticians would know IDL? (I believe I’m one of not many). For interdisciplinary collaborations, I think setting up a common language or two could accelerate the progress (a bad and living example is myself). Or setting a consistent fashion across communities of writing pseudo codes as a universal language that can be easily transcribed into your choice of language.
R is free and widely used among statisticians (believe it or not, statisticians also use various languages and softwares although astronomers may think we only use R) and I believe the counterpart in astronomy is python. Matlab can be a neutral choice since both communities are exposed to this language and very extensively used in computer science and engineering. Shall we talk about this?
[Added] I wonder if there’s a way, a plug-in maybe, instead of html code, to insert a little survey and to produce subsequent statistics for a review within blog. Thanks~
04-10-2009, 11:53 amAlex:
I personally think that Python with numpy/scipy/matplotlib and the ipython frontend is the best lingua franca for such collaborations. If you’re familar with Matlab and R, the transition is very easy. Also, you get real object orientation, a price tag of $0, a solid C API for numerically intensive work, and all of Python’s libraries for load/cleaning/dealing with the raw data. And, with RPy, you can use R from Python.
Oh, and, on top of that, you get happy astronomers ; always a good thing.
04-13-2009, 1:37 pm