

Unusual long-term variables found in DASCH
 The most exciting new science from DASCH will be long-term variables. We have found hundreds of new unusual long-term variables from partial analysis of about 5000 scans. Some of them do not match any of the common classes, and may instead suggest extremely short-lived evolutionary stages. Click on the left three examples which appear in Sumin Tang, Jonathan Grindlay, Edward Los, and Silas Laycock,
 DASCH Discovery of Large Amplitude ~10-100 Years Variability in K Giants
, ApJ, 710, L77-L81, 2010 February 10. According to their spectra, they are all ~K2 giants, but not R Coronae Borealis stars. Their nature remains unknown.
See our DASCH Talks and Publications website page for the latest listing of DASCH publications.
Overview of the Photometry Pipeline
Laycock, S. et. al, Digital Access to a Sky Century at Harvard. II: Initial Photometry and Astrometry
and Sumin Tang et al., Improved Photometry for the DASCH pipeline
contain a description of the photometry pipeline.
 We start with Emmanuel Bertin's SExtractor program to extract star images. Next, we run Astrometry.net which provides plate centers of our images with a 99.5% success rate. Our first test correctly identified the center for plate i52601 shown at left. This identification solved a long-standing mystery created when the operator of the 8" Draper Doublet pointed the telescope 1 hour in Right Ascension from the position he wrote in the logbook. The Astrometry.net program also identifies the rotation of the plate necessary to bring North up and whether a mosaic needs to be flipped because the plate was inserted emulsion-down in the telescope plate holder or the scanner.
After astrometry.net, we next use Jessica Mink's WCS tools to match the plate to the Tycho-2 catalog and account for stellar proper motions. We then use IRAF's ccmap to provide a 6th order polynomial fit of the distortions of the original telescope. We divide the plate into a 50 x 50 grid and make a final astrometric correction of the median residual positional error of all of the stars in the grid. We use the same grid to calculate an estimated extinction correction for all of the stars in each grid rectangle.
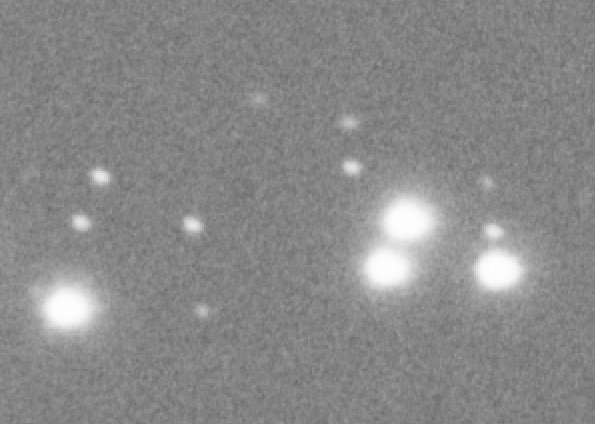 The image at the left shows the center of M44 taken in 1903 and illustrates a special analysis problem presented by old photometric techniques. Note that the triangle on the right has a ghost image on the left generated by a "Pickering Wedge". This wedge was placed on the telescope objective in an attempt to extend the dynamic range of film. When the primary star image is saturated, a researcher can measure the ghost images and add a known wedge magnitude offset. We recently discovered that the modern Damon Yellow series has a about 50 plates with similar ghost images probably caused by internal reflections in the filter.
 The solution to the ghost image problem is to superimpose the brightest stars on the plate and then search for the ghost image at the known offset of each Pickering Wedge. The search annulus shown in the graph on the left has a distinct peak at an angle of 180 degrees. With this information we can flag the ghost images so that they are not mistaken for novae.
After this step, we then perform a final match with the GSC2.3.2 catalog for every plate; and the Kepler Input Catalog for plates in the Orion Arm of the Milky Way. In April, 2011, we have begun use of the APASS catalog which offers accurate magnitudes in a brightness range which is a good match to our plate collection. Both the Kepler Input Catalog and APASS catalog are supplemented with proper motions from the UCAC4 catalog.
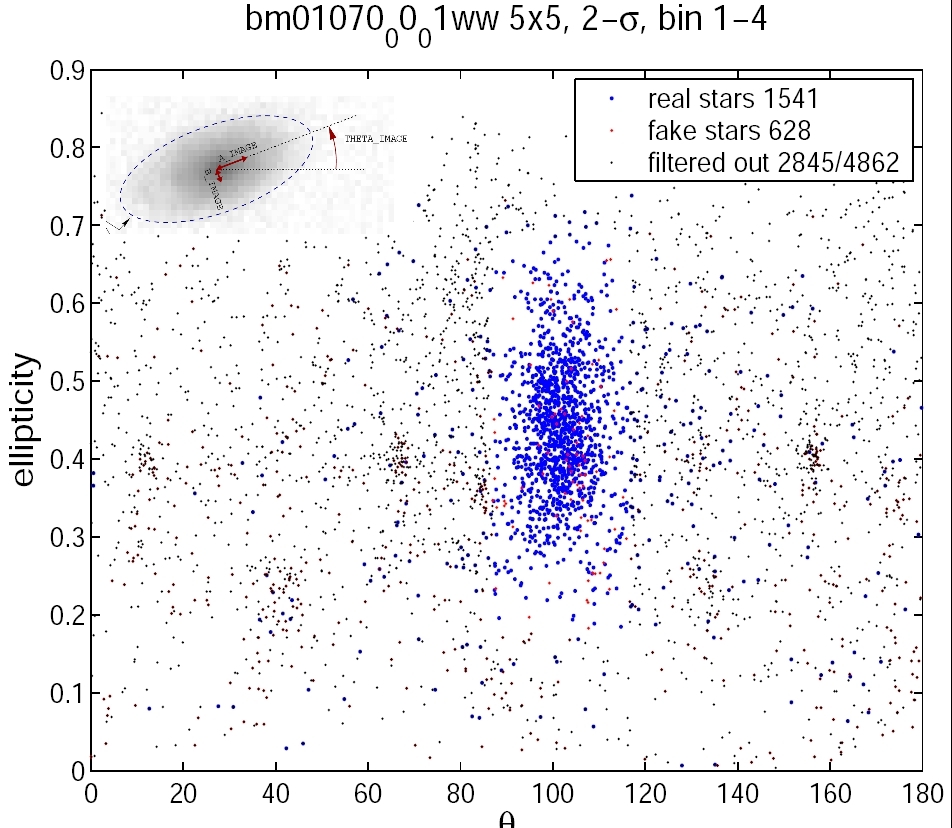 We next run a defect filter developed by Sumin Tang. This filter looks at four sets of SExtractor shape parameters for images that fit the GSC2.3.2 catalog and rejects images that do not match this profile. The image at left shows that slightly trailed images make it easier to separate genuine star images from dust, contamination, plate defects, and development defects.
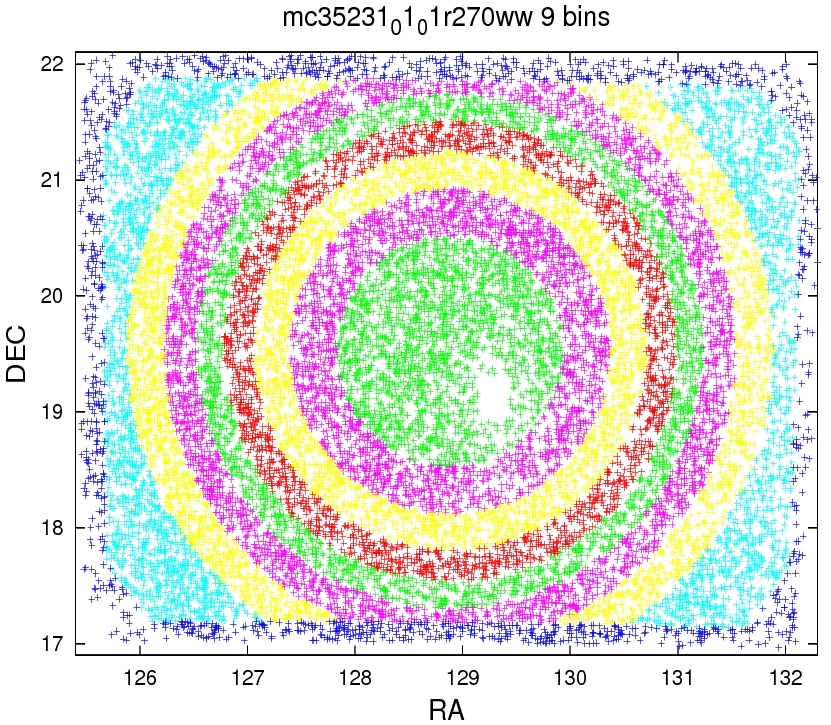 We next divide the images into nine annular bins in recognition of off-axis vignetting, coma, and other image distortions. We normally reject images in the outermost bin, bin 9, when searching for variables and novae because this bin usually shows severe problems with distortion and defects.
 For each annular bin, Sumin Tang developed an algorithm to estimate the colorterm necessary to transform the GSC2.3.2, Kepler, or APASS color system into the color system of the plate emulsion and any external color filters. Compare the colorterm correction of -0.24 for the Damon Blue plate on the left with the -0.78 correction for a Damon Red plate on the right.
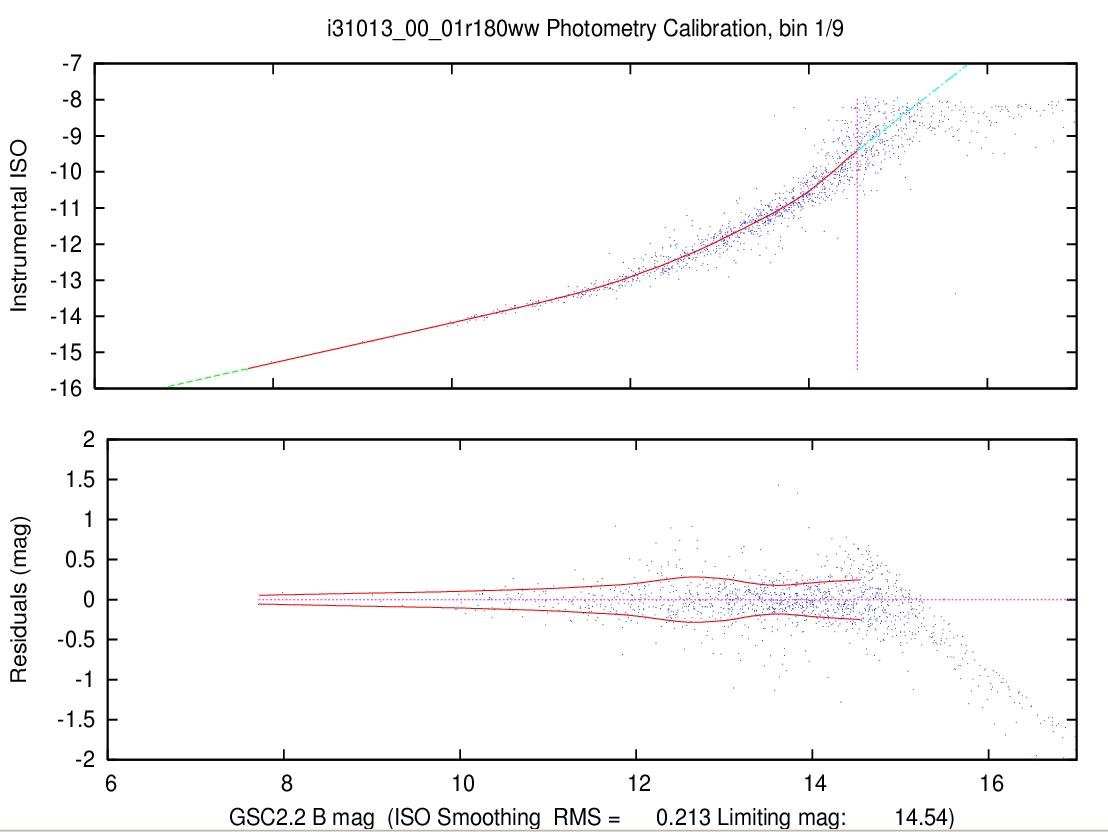 Sumin Tang developed an algorithm to convert the instrumental SExtractor magnitudes to GSC2.3.2, Kepler Input Catalog, or APASS catalog magnitudes using the "locally weighted scatterplot smoothing" or "lowess" curve fitting algorithm. This piece-wise linear technique makes no assumptions concerning the non-linear behavior of old emulsions.
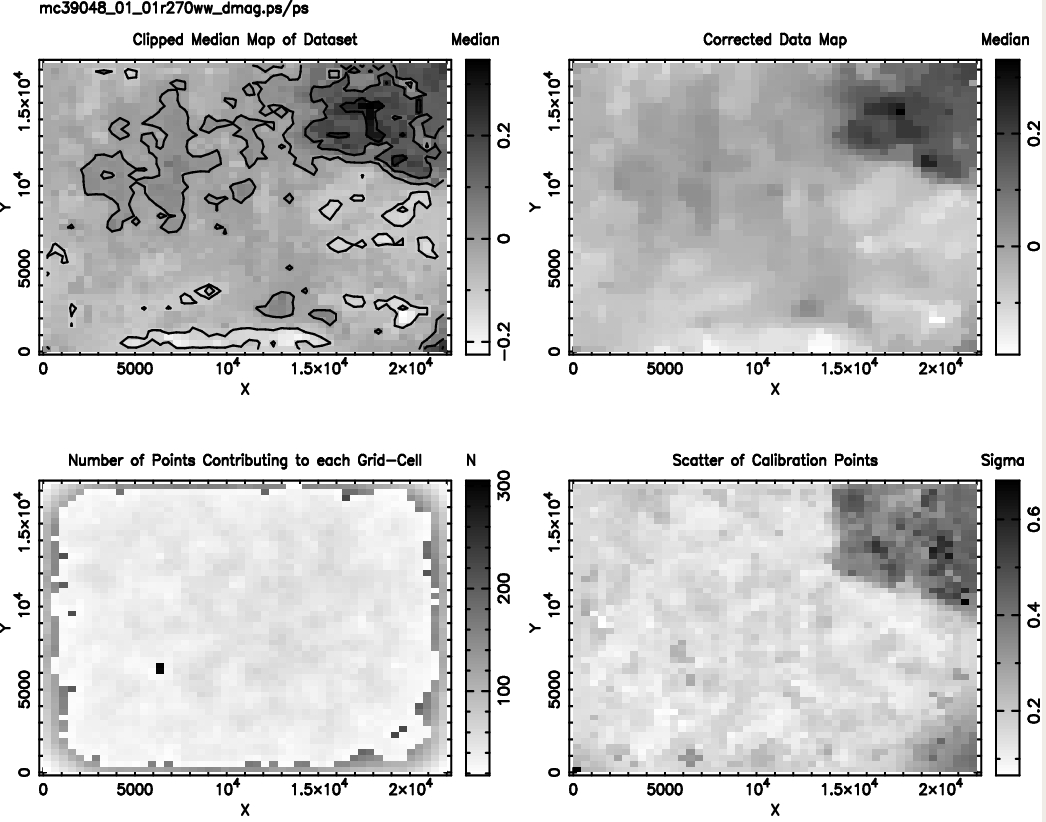 The next correction uses a local smoothing algorithm developed by Silas Laycock. We divide the plate into a 50 x 50 rectangular grid and make a final magnitude adjustment based on the the clipped median magnitude difference of all of the stars in the rectangular bin and the catalog magnitudes. This correction accounts for uneven emulsion, development, and original sky conditions in these large area plates.
In December, 2011 we implemented a second stage of smoothing, designed by Sumin Tang, which uses variable-size bins in both magnitude and plate location.
After the local smoothing correction, we reverse the extinction correction and return magnitudes to the original color system of the original catalog. At this stage we calculate magnitude estimates for all images which were not matched to the original catalog. The early astronomers, however, often exposed multiple star fields on a single plate in order to avoid errors caused by differences in plate emulsions and development. We, therefore, take the unmatched star images and rerun the pipeline as many times as is necessary to isolate all of the separate exposures. Our current record is the identification of 6 exposures each for plates mc04979, mc05077, and mc12668.
 Click on the thumbnail to the left to view the entire output of the photometry pipeline using the eclipsing binary RY Cancri as an example. This lightcurve contains 1042 measurements of brightness obtained over 104 years. The plot uses the GSC2.3.2 designation
 N2312220105
for this variable.
The star's magnitude (brightness) is plotted against time (first panel) and chronological plate sequence (second panel). The third panel shows in black the spatial bin of the image from bin 1 at the center to bin 9 at the edge; and in red the number of local calibrators to determine the image's local correction of irregular spatial variations in plate sensitivity. The fourth panel is used to verify that the star's variability does not come from image saturation effects. The fifth panel shows the local calibration error. Finally, the sixth panel shows the difference between magnitudes with (black) and without (red) local calibration. A description of plotting symbols appears on the database page.
 We have the option of removing all but the good points as shown by the lightcurve on the left.
Note the faint points below the rest, which correspond to eclipses of the primary star by its fainter companion.
We have the option of removing all but the good points as shown by the lightcurve on the left.
Note the faint points below the rest, which correspond to eclipses of the primary star by its fainter companion.
 Here is the lightcurve of RY Cancri folded at its known binary period of 1.092943 days, to show the eclipse. The
light-curve is plotted over two cycles, the first cycle shows estimated error bars for each point.
Here is the lightcurve of RY Cancri folded at its known binary period of 1.092943 days, to show the eclipse. The
light-curve is plotted over two cycles, the first cycle shows estimated error bars for each point.
 For quality control purposes we are also interested in stars that do NOT vary. Such constant-brightness stars
enable sensitive determination of various systematic effects and provide a completely independent measure of uncertainties. At left is the lightcurve of such a star
demonstrating about +/-0.1mag photometry over 600 plates, that span 100 years and 19 different plate-series.
For quality control purposes we are also interested in stars that do NOT vary. Such constant-brightness stars
enable sensitive determination of various systematic effects and provide a completely independent measure of uncertainties. At left is the lightcurve of such a star
demonstrating about +/-0.1mag photometry over 600 plates, that span 100 years and 19 different plate-series.