Archive for the ‘Astro’ Category.

[ArXiv] Pareto Distribution

Astronomy is ruled by Gaussian distribution with a Poisson distribution duchy. From time to time, ranks are awarded to other distributions without their own territories to be governed independently. Among these distributions, Pareto deserves a high rank. There is a preprint of this week on the Pareto distribution: Continue reading ‘[ArXiv] Pareto Distribution’ »

AstroStatistics School in India

From Prajval Shastri of IIAp comes news of the sequel to last year’s Astrostatistics school at Kavalur, India:

The Indian Institute of Astrophysics and the Center for Astrostatistics, Pennsylvania State University (USA) are jointly organising an 8-day school in fundamental statistical inference as applicable to astrophysical problems during 9-16 July, 2008 (www.iiap.res.in/astrostat). The school is intended for practising astrophysics researchers at all levels. Details may be found on the website of the school.

Continue reading ‘AstroStatistics School in India’ »

Eddington versus Malmquist

During the runup to his recent talk on logN-logS, Andreas mentioned how sometimes people are confused about the variety of statistical biases that afflict surveys. They usually know what the biases are, but often tend to mislabel them, especially the Eddington and Malmquist types. Sort of like using “your” and “you’re” interchangeably, which to me is like nails on a blackboard. So here’s a brief summary: Continue reading ‘Eddington versus Malmquist’ »

Astrometry.net

Astrometry.net, a cool website I heard from Harvard Astronomy Professor Doug Finkbeiner’s class (Principles of Astronomical Measurements), does a complex job of matching your images of unknown locations or coordinates to sources in catalogs. By providing your images in various formats, they provide astrometric calibration meta-data and lists of known objects falling inside the field of view. Continue reading ‘Astrometry.net’ »

[ArXiv] A fast Bayesian object detection

This is a quite long paper that I separated from [Arvix] 4th week, Feb. 2008:
      [astro-ph:0802.3916] P. Carvalho, G. Rocha, & M.P.Hobso
      A fast Bayesian approach to discrete object detection in astronomical datasets – PowellSnakes I
As the title suggests, it describes Bayesian source detection and provides me a chance to learn the foundation of source detection in astronomy. Continue reading ‘[ArXiv] A fast Bayesian object detection’ »

The WMAP Five-Year Data Release

There have been strong collaborations among statisticians, mathematicians, computer scientists, and astronomers (cosmologists) under WMAP (Wilkinson Microwave Anisotropy Probe) mission. Today, the 5th year data was released (The news is found here). For more, click Continue reading ‘The WMAP Five-Year Data Release’ »

The GREAT08 Challenge

Grand statistical challenges seem to be all the rage nowadays. Following on the heels of the Banff Challenge (which dealt with figuring out how to set the bounds for the signal intensity that would result from the Higgs boson) comes the GREAT08 Challenge (arxiv/0802.1214) to deal with one of the major issues in observational Cosmology, the effect of dark matter. As Douglas Applegate puts it: Continue reading ‘The GREAT08 Challenge’ »

AstroStat special session at HEAD

The High Energy Astrophysics Division of the American Astronomical Society will meet at Los Angeles on March 31 – April 3, and we have been allocated a slot for an AstroStatistics session. It will be a 60-minute lunch-time session, so we anticipate that the session will be dominated by poster haikus and panel discussions similar to the workshop we held during the New Orleans meeting in 2004.

The meeting website is at: http://www.confcon.com/head2008/.The abstract submission deadline is January 25, 2008 (now past, but late abstracts are not unheard of among astronomers).

If you are attending the meeting, and plan to present posters or talks that deal with astrostatistical methods or techniques, we welcome you to participate in this session. When you submit an abstract, be sure to indicate a category of “Other” and in the comments field state that it belongs with the AstroStatistics special session.If you have questions, please contact Aneta or me. There is also a page for this session on the astrostat google groups site.

Update (1/22): The abstract submission page currently says that only one abstract is allowed per person. We have been informed that this is incorrect, and that people can submit two abstracts, one for the special session and one as a regular contribution. Note that posters will be up only one day, and those associated with a special session will be put up the day of the session.

Update (1/26): A detailed program is not yet available, but here is a description of the session:

Astrostatistics: Methods and Techniques

This session will provide a forum for the discussion and presentation of statistical challenges in high energy astrophysics, highlighting the great deal of progress that has been made in methods and techniques over the past decade. The one hour session will cover the current and future directions in Astrostatistics, and will include a discussion of MCMC methods in the context of specific applications (such as propagating calibration errors, defining the significance of image features, etc.); a discussion of standardized methods for computing detection limits, upper limits, and confidence intervals for weak sources; and hypothesis testing and its limitations (including the significance testing of emission lines).

Update (2/19): We have been allocated the mid-day slot of March 31. The session will run from 12:30pm till 1:30pm2pm. The tentative program is as follows:

  • Remarks on current and future trends in AstroStatistics, by Eric Feigelson
  • Poster haiku
  • F-Test theory and usage, by David van Dyk
  • Discussion on MCMC techniques, led by Andy Ptak

Update (2/26): The final program is out, and the AstroStat session is scheduled for 12:30pm-2pm at the Museum/Bunker Hill Room.

Update (4/1): The talks and posters associated with the AstroStat special session are now online at
http://hea-www.harvard.edu/AstroStat/HEAD2008/. Additional comments and descriptions will be archived there.
Dance of the Errors

One of the big problems that has come up in recent years is in how to represent the uncertainty in certain estimates. Astronomers usually present errors as +-stddev on the quantities of interest, but that presupposes that the errors are uncorrelated. But suppose you are estimating a multi-dimensional set of parameters that may have large correlations amongst themselves? One such case is that of Differential Emission Measures (DEM), where the “quantity of emission” from a plasma (loosely, how much stuff there is available to emit — it is the product of the volume and the densities of electrons and H) is estimated for different temperatures. See the plots at the PoA DEM tutorial for examples of how we are currently trying to visualize the error bars. Another example is the correlated systematic uncertainties in effective areas (Drake et al., 2005, Chandra Cal Workshop). This is not dissimilar to the problem of determining the significance of a “feature” in an image (Connors, A. & van Dyk, D.A., 2007, SCMA IV). Continue reading ‘Dance of the Errors’ »

A bit of a mess

Due to a monumental cock-up, UK Astronomy is set to lose something like 25% of its budget. This will decimate astronomy in the UK twice over (including the VO implementation, AstroGrid), and will surely reverberate all across the world. Continue reading ‘A bit of a mess’ »

ChandraBlog

Our colleagues at Chandra public outreach have started a new blog, ChandraBlog – http://chandra.harvard.edu/blog/ which appears to be dedicated to news about the latest discoveries from Chandra. Mosey over and take a look.

The Digital Universe

Another one in the CXC/CfA Visualizing Astronomy series: “The Digital Universe: Cosmic Cartography and Data Visualization”, by Brian Abbott of Hayden Planetarium & Department of Astrophysics, next Tuesday, Nov 13, at 2pm in Phillips. Continue reading ‘The Digital Universe’ »

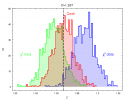
An example of chi2 bias in fitting the X-ray spectra.

The chi2 bias can affect the results of the X-ray spectral fitting and it
can be demonstrated in a simple way. The described simulations can be done
in Sherpa or XSPEC, the two software packages that allow for simulating the X-ray
spectra using a function called “fakeit”.

Here I assume an absorbed power law model with the sets of 3 parameters
(absorption column, photon index, and normalization) to simulate Chandra X-ray
spectrum given the instrument calibration files (RMF/ARF) and the Poisson noise.
The resulting simulated X-ray spectrum contains the model predicted counts with
the Poisson noise. This spectrum is then fit with the absorbed power law model to get
the best fit parameter values for NH, photon index and normalization.

I simulate 1000 spectra and fit each of them using different statistics: chi2 data variance,
chi2 model variance and Cash/C-statistics.

The next step is to plot the simulated distributions of the parameters and compare them
to the assumed values for the simulations. The figure shows the distribution of the photon
index parameter obtain from the fit of the spectra generated for the assumed simulated value
of 1.267. The chi2 bias is evident in this analysis, while the
CSTAT and Cash statistics based on the likelihood behave well. chi2 model variance
underestimates the simulated value, chi2 data variance overestimates this parameter.


Distributions of parameter values based on fitting the simulated X-ray data.

The plot shows the distribution of photon index parameters obtained by
fitting the simulated X-ray spectra with about 60000 counts and using the
three different statistics: chi2 with the model variance, chi2 with
data variance and C-statistics (Cash). The assumed value in the
simulations 1.267 is marked with the solid line.

The power of wavdetect

wavdetect is a wavelet-based source detection algorithm that is in wide use in X-ray data analysis, in particular to find sources in Chandra images. It came out of the Chicago “Beta Site” of the AXAF Science Center (what CXC used to be called before launch). Despite the fancy name, and the complicated mathematics and the devilish details, it is really not much more than a generalization of earlier local cell detect, where a local background is estimated around a putative source and the question is asked, is whatever signal that is being seen in this pixel significantly higher than expected? However, unlike previous methods that used a flux measurement as the criterion for detection (e.g., using signal-to-noise ratios as proxy for significance threshold), it tests the hypothesis that the observed signal can be obtained as a fluctuation from the background. Continue reading ‘The power of wavdetect’ »

~ Avalanche(a,b)

Avalanches are a common process, occuring anywhere that a system can store stress temporarily without “snapping”. It can happen on sand dunes and solar flares as easily as on the snow bound Alps.

Melatos, Peralta, & Wyithe (arXiv:0710.1021) have a nice summary of avalanche processes in the context of pulsar glitches. Their primary purpose is to show that the glitches are indeed consistent with an avalanche, and along the way they give a highly readable description of what an avalanche is and what it entails. Briefly, avalanches result in event parameters that are distributed in scale invariant fashion (read: power laws) with exponential waiting time distributions (i.e., Poisson).

Hence the title of this post: the “Avalanche distribution” (indulge me! I’m using stats notation to bury complications!) can be thought to have two parameters, both describing the indices of power-law distributions that control the event sizes, a, and the event durations, b, and where the event separations are distributed as an exponential decay. Is there a canned statistical distribution that describes all this already? (In our work modeling stellar flares, we assumed that b=0 and found that a>2 a<-2, which has all sorts of nice consequences for coronal heating processes.)