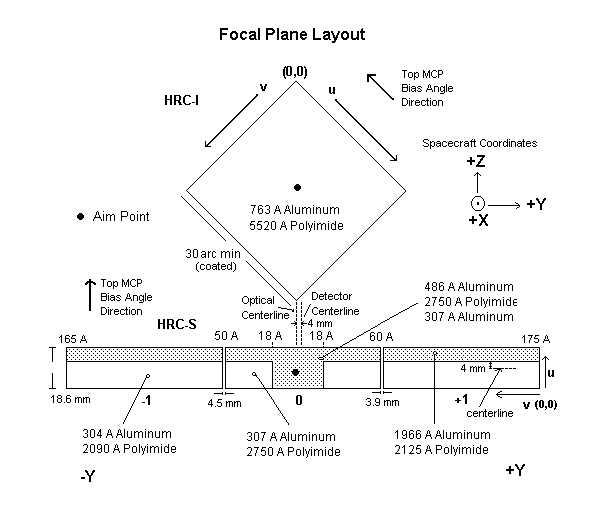
fits(binary) - qe map
dgp.img(binary) - degapped flat field image (displayed by SAOimage using -u2 flag)
128.dgp.img(binary) - degapped 128 x 128 flat field image (displayed by SAOimage using -u2 flag)
dgp.gmi(binary) - degapped gain map image (displayed by SAOimage using -u2 flag)
prj(ascii) - image projections
pha(ascii) - pulse height distribution
dgp(ascii) - degap parameters
In order to download the files, hold down the "Shift" key and click on the file.
Ascii files may be displayed by merely clicking on them.
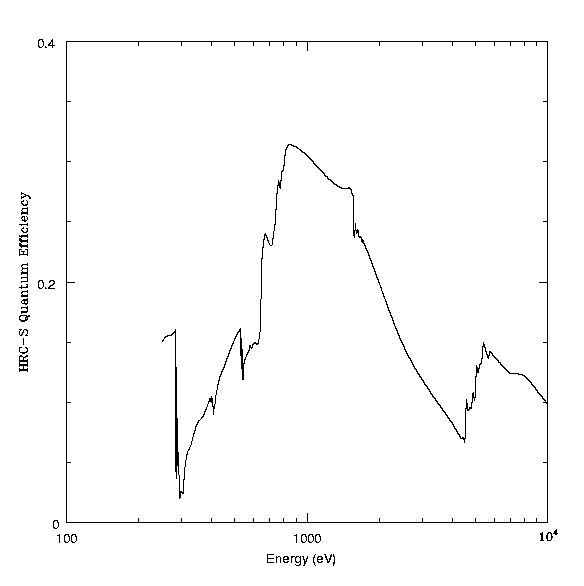
HRC-S Quantum Efficiency and Effective Area
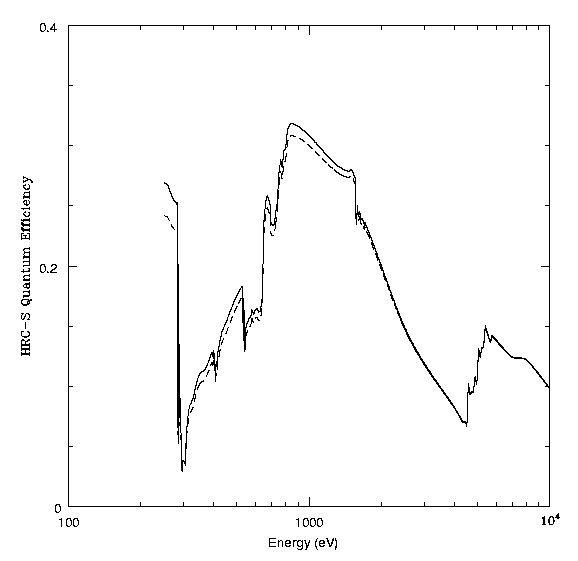
QE model of HRC-S in 1st order of the LETG (ie, the QE of the HRC-S at the position where the first order at energy E is dispersed by the LETG) vs energy. The solid curve is the -1 order, the dashed the +1 order.
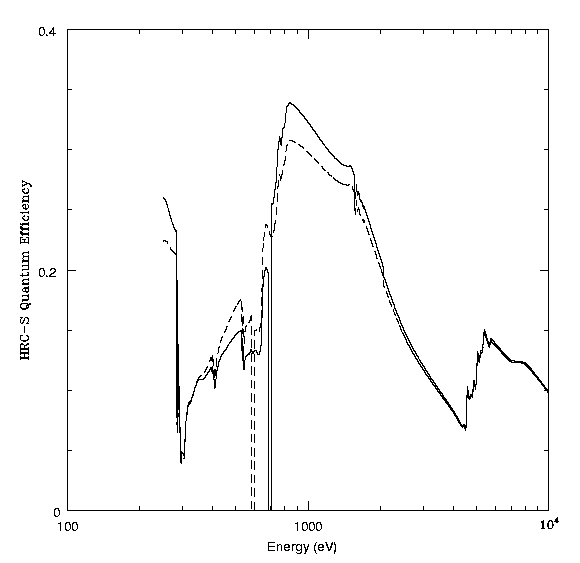
QE model of HRC-S in 3rd order of the LETG (ie, the QE of the HRC-S at the position where the third order at energy E is dispersed by the LETG) vs energy. The solid curve is the -3 order, the dashed the +3 order. The dropouts at 700 eV and 600 eV are caused by the gaps between the segments (see the Focal Plane Layot above).
Quantum Efficiency Calibration of HRC-S (postscript file)
Data tables containing the HRC-S QE:
hrcs.orders.out
hrcs.3rdorders.out
hrcs.5thorders.out
Each file above has 7 columns: Energy, wavelength, dispersion distance from zeroth order, QE in the +1 (+3, +5) order, QE in the -1 (-3, -5) order, the MCP QE at 0th order, and the HRC-S QE (MCP & UVIS) in zeroth order
| Detector segment | Model (ps file) | Trans. File | QE file |
| 0, thick Al ("T") | hrcs_uv0.ps | hrcs_uvt.prn | hrcs_uvqe.prn |
| 0, thin Al | hrcs_uv0thin.ps | hrcsi_uvt.prn | hrcsi_uvqe.prn |
| +1, -1, thick Al | hrcs_uvthick.ps | hrcsthick_uvt.prn | hrcsthick_uvqe.prn |
| +1, -1, thin Al | hrcs_uv.ps | hrcso_uvt.prn | hrcso_uvqe.prn |
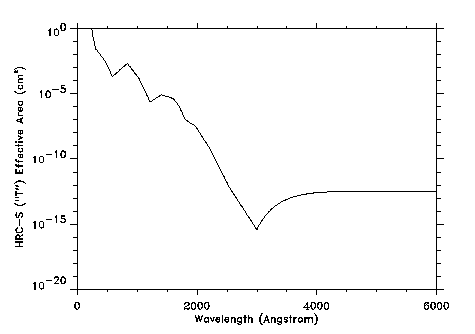
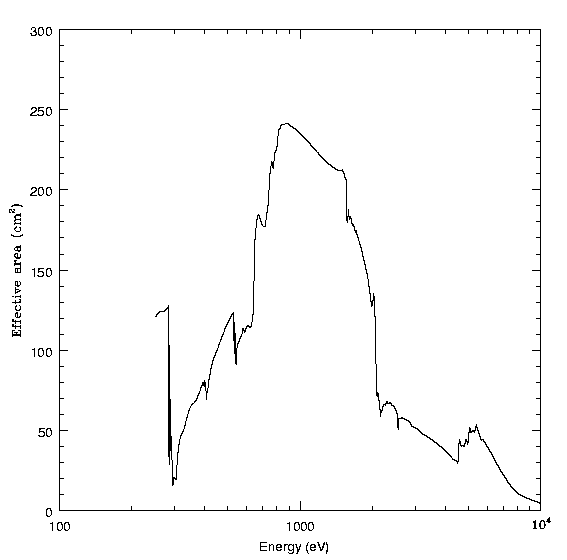
HRC-S/HRMA effective area model for out-of-band ultraviolet and visible light for the "T" section of the central segment (see the Focal Plane Layout above). Effective area = 1100 cm^2 x QE.
V axis: 6.429 microns per pixel
U axis: 6.429 microns per pixel
A memorandum discussing the linearity of the LETG/HRC-S system can be found at http://hea-www.harvard.edu/HRC/calib/letg_analysis.ps (postscript file)
HRC-S Coordinates and Active Area
The active area of the three HRC-S segments is given below:
u dimension: 17.95 mmv dimension:
0 segment - 98.32 mm
+1,0 gap width - 3.91 mm
+1 segment - 98.17 mm
-1, 0 gap width - 4.53 mm
-1 segment - 97.71 mmUncertainty is +/-0.05 mm.
A memorandum discussing the HRC-S coordinate system can be found at http://hea-www.harvard.edu/HRC/calib/hrc-s-coords.ps (postscript file)
A drawing of the spectroscopic detector showing key dimensions: spec.gif
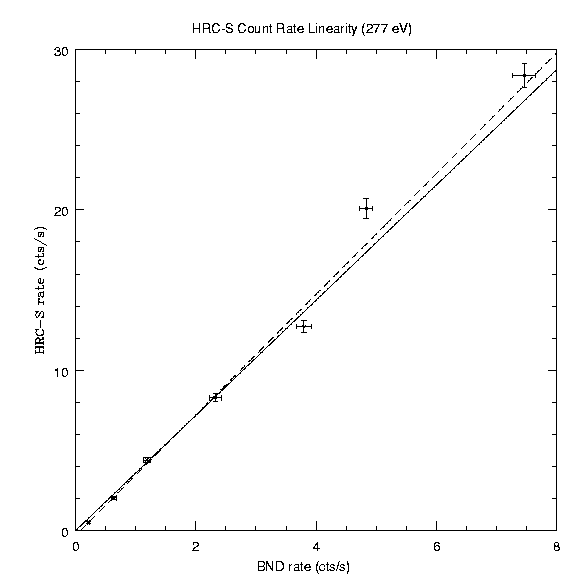
Point source count rate linearity at Carbon K alpha (277 eV). The solid line is the best fit line, if the fit is forced through the origin. The dashed line is the best fit line, if the fit is not forced through the origin. The count rate linearity was determined by measuring the HRC-S rate as a function of the BND-H rate (proportional to the incident flux density).
See also Count Rate Linearity of the AXAF High Resolution Camera (HRC), D. Pease and H. Donnelly (postscript file) or HTML file).
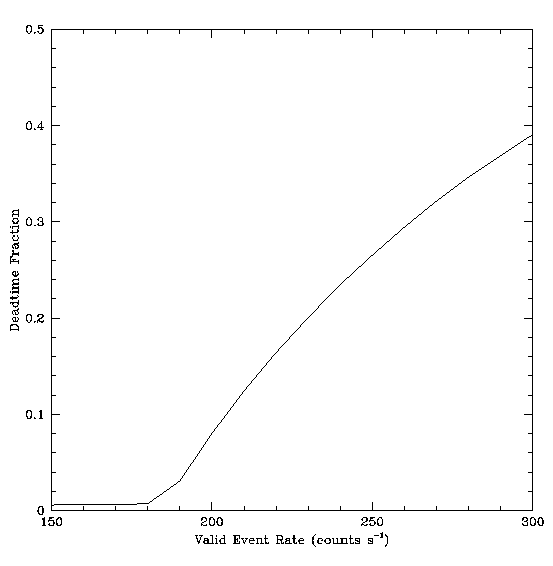
A model of electronic deadtime and telemetry saturation (extended source count rate linearity).
See HRC Deadtime and Telemetry Saturation, M. Juda and A. Dobrzycki (postscript file) for a complete discussion.
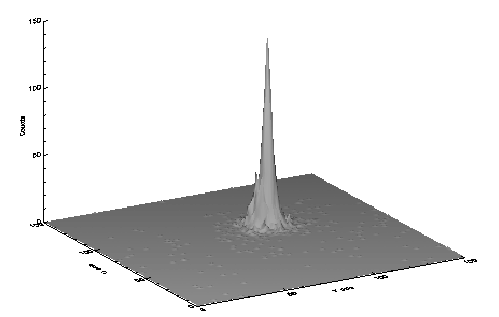
Surface plot of the point spread function of the combined HRC-S and HRMA at Carbon K alpha (277 eV).
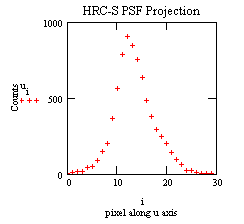
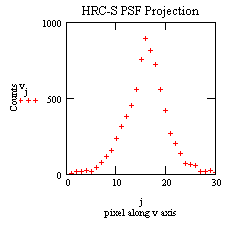
Encircled energy versus radius of the HRC-S/HRMA at 277 eV. (postscript file)
Pulse Height Distributions as a Function of Energy
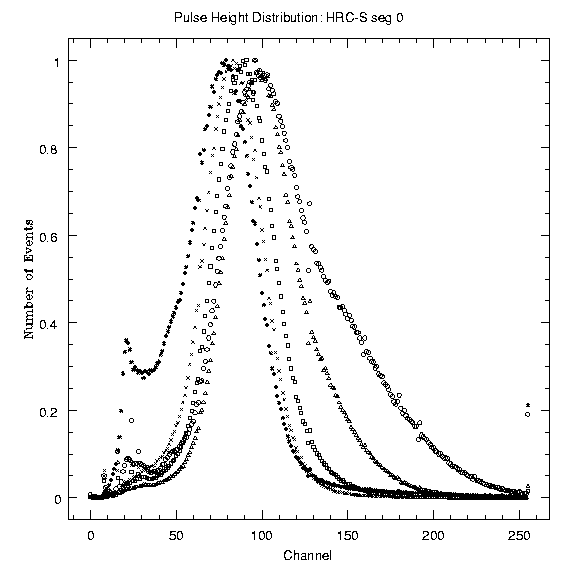
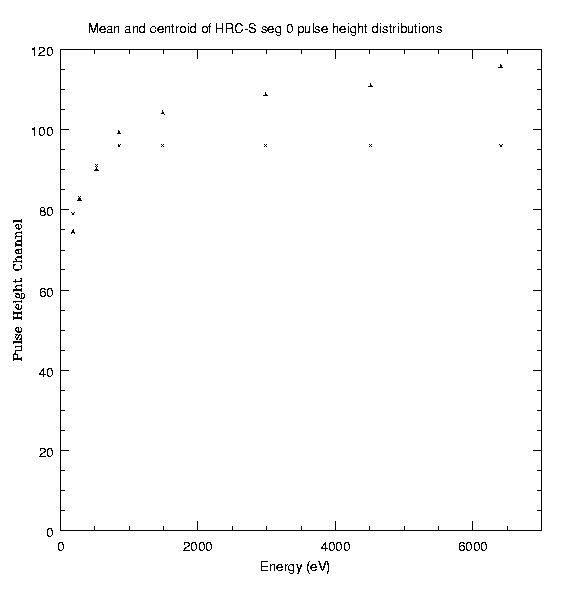
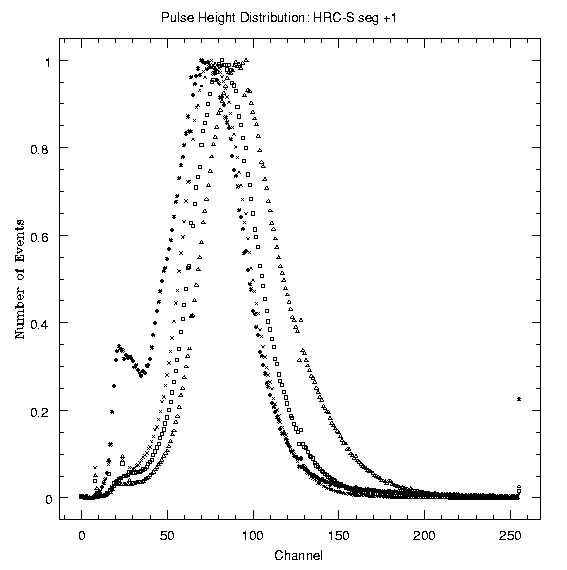
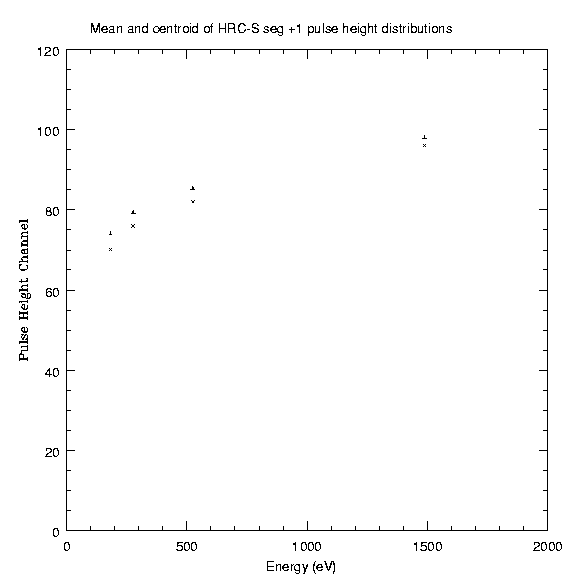
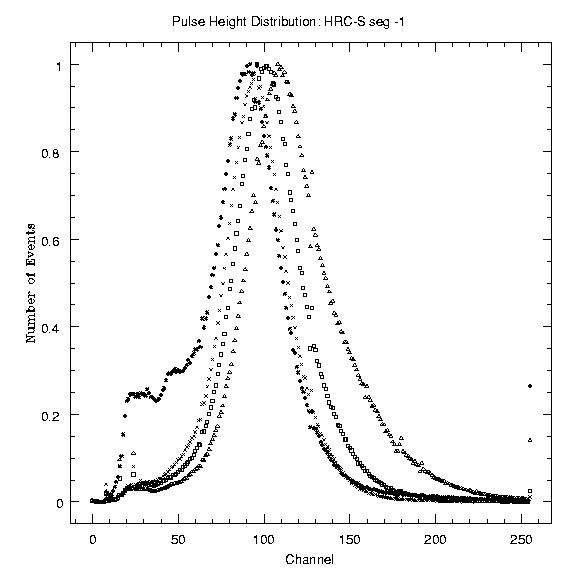
Plots of the pulse height distributions of the three segments of the HRC-S are given below. Symbol key: B Ka (the asterisk), C Ka (the X), O Ka (the square), Al Ka (the triangle), and Fe Ka (the circle; for segment 0, only). There is considerable variation of both shape and centroid of the PHDs with photon energy in all three segments. A plot of the mean and the centroid of each distribution are also given below. Note the low energy shelf on the B Ka PHDs in all three segments. There is a warm spot on the central segment that accounts for about 25% percent of the counts in this tail. There are, however, no significant warm spots on either of the wing segments. We should point out that these PHDs are averages over an entire segment. These distributions could, in principle, be used to derive some limited (non-dispersive) spectral information.

Quantum Efficiency vs Angle of Incidence
A report of qe vs angle of incidence can be found at http://hea-www.harvard.edu/HRC/calib/pore_ang.ps (postscript file)
In-Flight
Degap Corrections (31 October 1999)
Each MCP segment has four files.
The p and m refer to whether the fine position is negative (minus)
or positive.
Segment 0 (v coarse positions 64-126):
Segment +1 (v coarse positions 0-63):
Segment -1 (v coarse positions 127-192):
For an explanation of the tables above:
Degap Corrections for HRC-I and HRC-S Detectors (A postscript memorandum)
Degap as a Transformation of Probability Distribution Problem (A postscript memorandum)
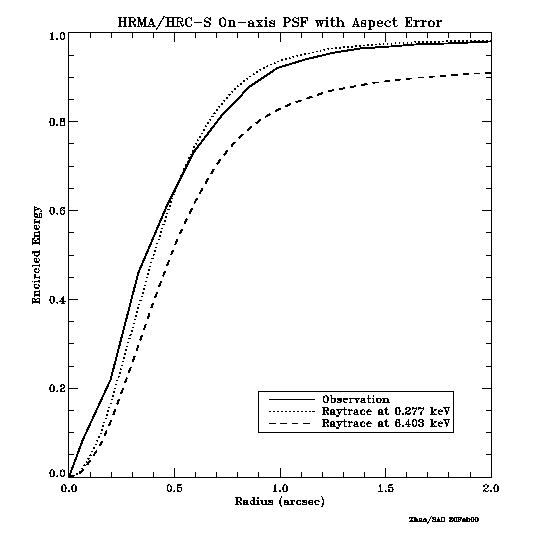
For the combined HRC-S/HRMA, the predicted and observed (LMC X-1) fractional encircled energy as a function of radius for an on-axis point source. The predictions for 0.277 keV and 6.40 keV X-rays include contributions of the finite resolution of HRC-S and the aspect solution to the encircled energy.
Encircled Energy vs Angle Off-axis
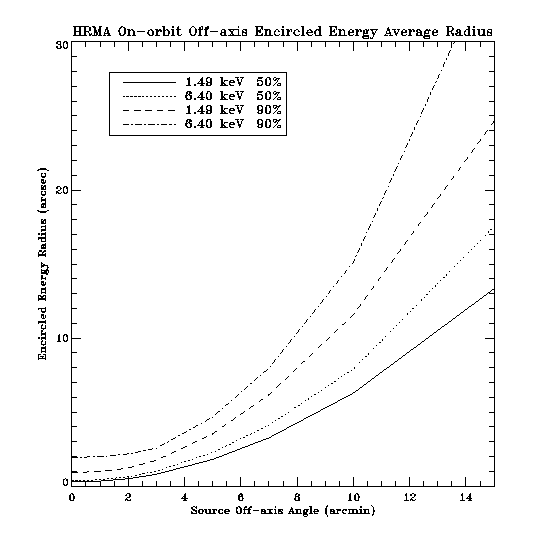
Encircled energy as a function of source off-axis angle for 50% and 90% encircled energy for 1.49 keV and 6.40 keV X-rays for the combined HRC-S/HRMA.
The quiescent (about 80% of the observing time) background rate is 7.5 x 10⁻⁵ cts s-1 arcsec-2 before ground processing. Simple filtering which excludes events with PHA's equal to 255 reduces this background by about 25%. p> Effective Area
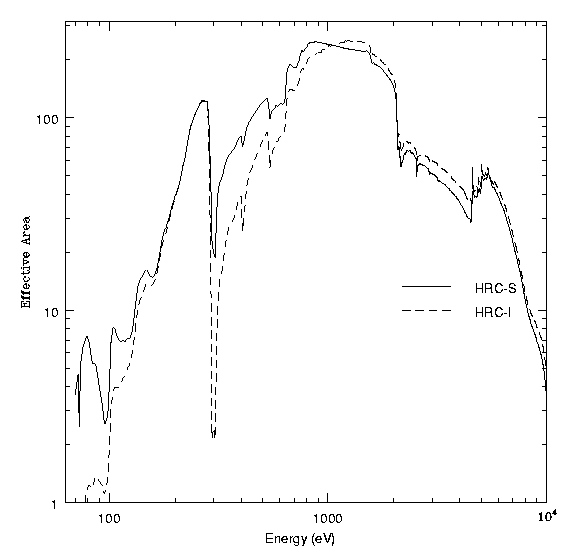
Effective area table (First column is energy in eV, fifth column is effective area in cm2)
References
Performance and Calibration of the AXAF High Resolution Camera: II. the Spectroscopic Detector (Kraft, R., et al., 1997; in postscript) gives details of the measurement procedures, analysis techniques, and results of the XRCF and flat field calibrations.
In-flght Performance of the Chandra High Resolution Camera (Murray, S.S., et al., 2000; in postscript)
In-flight Performance and Calibration of the Chandra High Resolution Camera Spectroscopic Readout (Kraft, R., et al., 2000; in postscript)
The Out-of-band Response of the HRC on Chandra (Zombeck, M.V., et al., 2000, in postscript)
Event Screening for the Chandra X-ray Observatory High Resoloution Camera (HRC) (Murray, S.S., et al., 2000; in postscript)
Improving Chandra High Resolution Camera event positions via corrections to cross-grid charge detector signals (Juda, M., et al., 2000; in postscript)
Time Tag Investigation (pdf file)
Secondary Science Double Counting
The UV/Visible Light Sensitivity of the HRC, Chandra Calibration Workshop, 2002.
Response of the HRC to Vega, memo, October 28, 2002.
How to display postscript plots with the Netscape browser.
