Since the bulk of the data for rotational modulation were taken during short
(< 11 night) runs, there is a great deal of variation in the sensitivity to
periods, depending on the length of the period. The searches are much more
sensitive to short periods than to longer
ones. To test the sensitivity in a quantitative way, I made
numerical simulations of the photometric data.
For the simulation, the input data was a pure sine wave.
Poisson noise was added so that the signal to noise ratio (S/N)
varied from
5:1 to 1:1.![]() The run was simulated to be 11 nights long with anywhere
from one to seven nights randomly removed to simulate bad weather.
The data were sampled, three times a night, roughly at 9 p.m., midnight and
3 a.m. to simulate the nominal sampling. The sampled data were then processed
through the periodogram routine. Forty--eight sets of input parameters were
used, eight different periods each with six different signal to noise
settings. Each
parameter set was simulated 1000 times. An example of a simulation with an
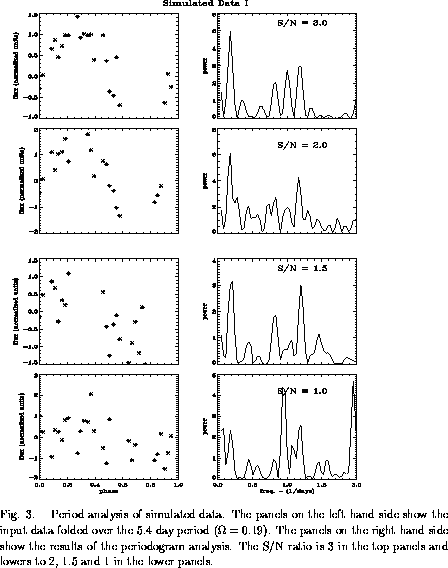
input period of 5.4 days is shown in Figure 3.
The run was simulated to be 11 nights long with anywhere
from one to seven nights randomly removed to simulate bad weather.
The data were sampled, three times a night, roughly at 9 p.m., midnight and
3 a.m. to simulate the nominal sampling. The sampled data were then processed
through the periodogram routine. Forty--eight sets of input parameters were
used, eight different periods each with six different signal to noise
settings. Each
parameter set was simulated 1000 times. An example of a simulation with an
input period of 5.4 days is shown in Figure 3.
From this figure, both the strengths and the weakness of period
finding become apparent. The strength is that in all cases, even down to
signal to noise levels of one, a large percentage of the power can be found in
the correct period. Weaknesses are noted in the two aliased peaks near 1.18
days and 0.82 days. 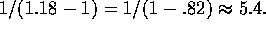 A similar pair of
peaks is present either side of 0.5 days (frequency = 2). Such families of
solutions are a result of the uneven and clumped sampling. The aliased
peaks can be as strong or stronger than the correct peak. In the example,
the correct peak is
given some additional power due to its low frequency. The lowest frequency peak
covers a very large portion of the search window.
In the highest S/N case, the full width half maximum of the 5.4 day
peak ranges from about 4 days to
about 6.5 days. The low spectral resolution at lower frequencies can inflate
the strengths of these peaks. Also, note that in one of the high S/N
cases, the sampling causes a split the normal family of solutions into
two narrower families.
A similar pair of
peaks is present either side of 0.5 days (frequency = 2). Such families of
solutions are a result of the uneven and clumped sampling. The aliased
peaks can be as strong or stronger than the correct peak. In the example,
the correct peak is
given some additional power due to its low frequency. The lowest frequency peak
covers a very large portion of the search window.
In the highest S/N case, the full width half maximum of the 5.4 day
peak ranges from about 4 days to
about 6.5 days. The low spectral resolution at lower frequencies can inflate
the strengths of these peaks. Also, note that in one of the high S/N
cases, the sampling causes a split the normal family of solutions into
two narrower families.
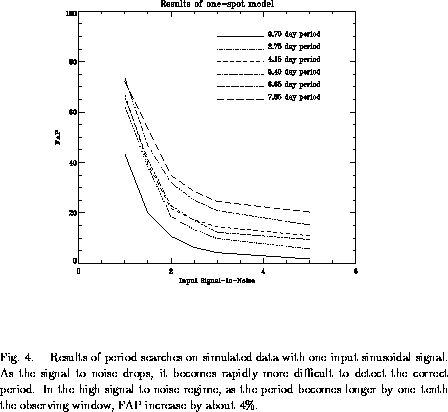
The overall results of the simulation are given in Figure 4. The main lessons found here are:
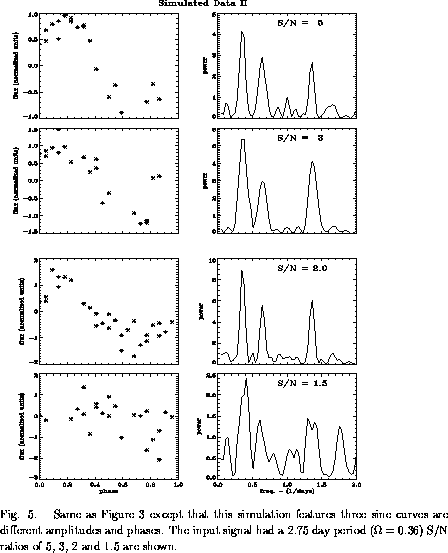
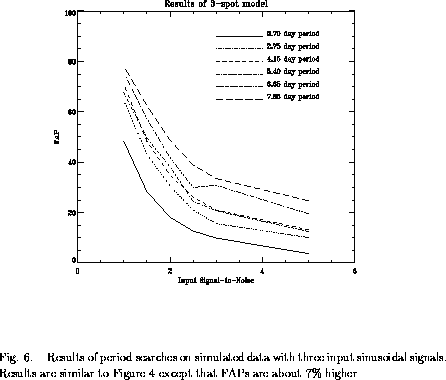
In reality, it is hard to imagine a spot modulation being perfectly sinusoidal. If a star has a single spot, or spotted region, on its surface the observed variation will be constant (bright) for the time that the spot is on the far side. A slow fall (rise) will be observed as the spot rotates into (out of) view. The flux will be nearly constant (dim) in between since the projected area of the spot does not change. Further, there is no reason to expect that any given star will have only one spot. In fact, Doppler imaging of active stars usually indicates more than one spotted region, and none of the spotted regions are round (cf. Strassmeier et al. 1994). To simulate this more realistic case, the above model was modified so that the input signal was the sum of three sine waves. The sine waves are assigned random strength. The phases are assigned with a random fluctuation with a standard deviation of one about phase 0 so that two spots do not cancel each other. Of course in the real universe, two spots may cancel each other so this simulation still overestimates the ability of the periodogram to detect periods. Also, input signals are still initially sine waves and other possibilities such as differential rotation have not been explored. With these caveats in mind, the results are shown in Figures 5 and Figure 6. Not surprisingly, the results are far more complicated than the single spot case. The power peaks can develop side lobes and the bifurcation of a family of solutions into two or more is common, even at high S/N. In general, higher S/N is required to detect any given period and the FAP is higher.