Oct 23rd, 2009| 12:26 pm | Posted by hlee
I watched a movie in which one of the characters said, “country A has nukes with 80% chance” (perhaps, not 80% but it was a high percentage). One of the statements in that episode is that people will not eat lettuce only if the 1% chance of e coli is reported, even lower. Therefore, with such a high percentage of having nukes, it is right to send troops to A. This episode immediately brought me a thought about astronomers’ null hypothesis probability and their ways of concluding chi-square goodness of fit tests, likelihood ratio tests, or F-tests.
First of all, I’d like to ask how you would like to estimate the chance of having nukes in a country? What this 80% implies here? But, before getting to the question, I’d like to discuss computing the chance of e coli infection, first. Continue reading ‘The chance that A has nukes is p%’ »
Tags:
chances,
chi-square statistic,
composite likelihood,
delta chi-square,
F-test,
fiducial likelihood,
likelihood,
LRT,
p-value,
posterior,
prior Category:
Bayesian,
Cross-Cultural,
Fitting,
Frequentist,
Misc,
Quotes,
Uncertainty |
Comment
Jul 12th, 2009| 07:33 pm | Posted by hlee
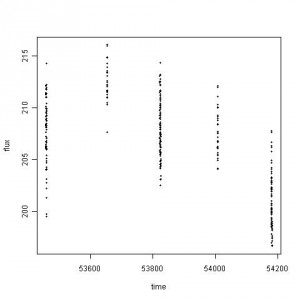
An email was forwarded with questions related to the data sets found in “Be an INTEGRAL astronomer”. Among the sets, the following scatter plot is based on the Crab data.
Continue reading ‘different views’ »
Tags:
ANOVA,
block design,
crab nebula,
F-test,
gaussinity,
integral,
light curve Category:
Astro,
Cross-Cultural,
gamma-ray,
High-Energy,
Jargon,
Objects,
Uncertainty |
Comment
Jun 2nd, 2009| 03:03 am | Posted by hlee
Even though I traced the astronomers’ casual usage of the null hypothesis probability in a fashion of reporting outputs from data analysis packages of their choice, there were still some curious cases of the null hypothesis probability that I couldn’t solve. They are quite mysterious to me. Sometimes too much creativity harms the original intention. Here are some examples. Continue reading ‘Curious Cases of the Null Hypothesis Probability’ »
Tags:
cases,
chi-sq,
curious,
degree of freedom,
dof,
F-test,
goodness-of-fit test,
Model Selection,
null hypothesis probability,
p-value,
reduced chi-sq Category:
arXiv,
Astro,
Cross-Cultural,
Fitting,
Methods,
Uncertainty |
3 Comments
Jun 18th, 2008| 01:00 pm | Posted by vlk
From Protassov et al. (2002, ApJ, 571, 545), here is a formal expression for the Likelihood Ratio Test Statistic,
TLRT = -2 ln R(D,Θ0,Θ)
R(D,Θ0,Θ) = [ supθεΘ0 p(D|Θ0) ] / [ supθεΘ p(D|Θ) ]
where D are an independent data sample, Θ are model parameters {θi, i=1,..M,M+1,..N}, and Θ0 form a subset of the model where θi = θi0, i=1..M are held fixed at their nominal values. That is, Θ represents the full model and Θ0 represents the simpler model, which is a subset of Θ. R(D,Θ0,Θ) is the ratio of the maximal (technically, supremal) likelihoods of the simpler model to that of the full model.
Continue reading ‘Likelihood Ratio Test Statistic [Equation of the Week]’ »
Tags:
EotW,
Equation,
Equation of the Week,
F-test,
likelihood,
likelihood ratio test,
LRT,
Protassov,
Rostislav Protassov Category:
Fitting,
Jargon,
Stat |
2 Comments
May 1st, 2008| 02:00 pm | Posted by vlk
Why is it that detection of emission lines is more reliable than that of absorption lines?
That was one of the questions that came up during the recent AstroStat Special Session at HEAD2008. When you look at the iconic Figure 1 from Protassov et al (2002), which shows how the null distribution of the Likelihood Ratio Test (LRT) and how it holds up for testing the existence of emission and absorption lines. The thin vertical lines are the nominal F-test cutoffs for a 5% false positive rate. The nominal F-test is too conservative in the former case (figures a and b; i.e., actual existing lines will not be recognized as such), and is too anti-conservative in the latter case (figure c; i.e., non-existent lines will be flagged as real). Continue reading ‘The Flip Test’ »
Jan 18th, 2008| 02:24 pm | Posted by hlee
Seven preprints were chosen this week and two mentioned model selection. Continue reading ‘[ArXiv] 3rd week, Jan. 2008’ »
Tags:
AIC,
Bayesian,
BIC,
CLT,
correlation,
F-test,
FoF,
hypothesis testing,
Kolmogorov-Smirnoff test,
LRT,
Model Selection,
modeling,
sunspots Category:
arXiv |
Comment
