X-ray Binaries: LCs , CCIs, and SEDs

This project has been supported in part by grants from NASA through the Astrophysics
Data Analysis Program and the Smithsonian Institution Endowment program.

  This site displays X-ray lightcurves and three-dimensional CCI plots using the first 13 years of RXTE data. Only 5 sigma detections are used. Where available we show spectral energy distributions (SEDs) of X-ray binaries from optical to X-ray energy range. Objects can be accessed in RA order or as a function of binary type (BH, NS, HMXB, LMXB). The CCI plots are particularly useful in identifying the different binary types. Superorbital phase and X-ray spectral states can be determined using the RXTE lightcurves of the individual sources. X-ray binaries (XRBs) owe their prominence to one of the most efficient energy release mechanisms known: accretion onto a compact object. Accretion processes are ubiquitous in the Universe and are associated with star formation, interacting main sequence binaries, active galactic nuclei, and quasars. XRBs are the most nearby, easily studied example of the accretion process. They are of additional interest as the endpoints of stellar evolution and serve as laboratories for the study of matter under extreme conditions.

Website redesign by Craig Anderson Summer 2011.
3-d figures with Mathematica implemented by Bram Boroson (Clayton State University) June 2011.
3-d figures updated to include only 5 sigma points by Bhaskar Balaji (MIT) in January 2013.

Updates of files on this webpage by:
Bhaskar Balaji Unionville High School Summer 2012
Robert Sylvia Medfield High School Summer 2011
Harry Hausner Gann High School Summer 2010
Emma Rosenfeld Medfield High School Summer 2009
Michael Lannum Westwood High School Summer 2009
Alex Grant (Commonwealth High School) Spring 2009
Taylor Sipple Medfield High School Summer 2008
Brenny Costello Dover-Sherborn High School Summer 2008
Melissa Warstadt Sharon High School Summer 2007 (Brown University)

X-ray Spectral States

The use of RXTE to determine spectral states.
What are X-ray Binaries?

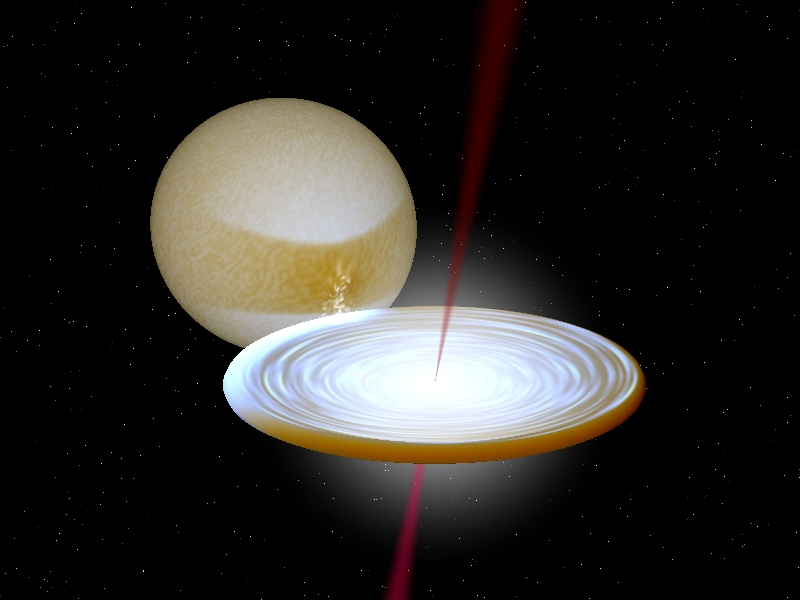
A brief definition of X-ray Binaries
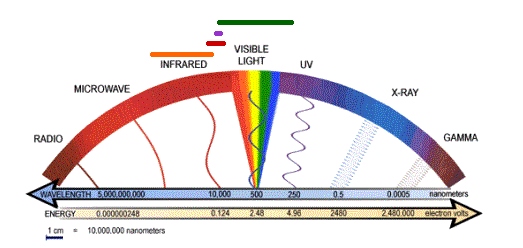
Why Spectral Energy Distributions (SEDs)?

The need for SEDs
Color-Color-Intensity (CCI) diagrams: Putting X-ray binaries in their proper place.

Upper left: Black hole systems with high mass companions in blue, black hole systems with low mass companions in green, X-ray pulsars in red, and non-pulsing neutron star systems in Cyan.

Upper right: Systems with resolved jets in blue, systems with no jets (pulsars) in red.

Lower left: Black hole systems with low-mass companions in green; black hole systems with high-mass companions in blue.

Lower right: Persistent black hole systems in blue; transient black hole systems in green. As defined by Mclintock, Narayan, & Steiner (2013). For these particular sources the only change between the two lower plots is that LMC X-3 was switched to transient instead of high-mass.

Instruments of Interest

Instruments from which we would like to receive data.
Request for Spectral Data

We would like spectral data of any XRBs, in any state, from any instrument, in any units.
We will also provide any data we have that may be of use to specific projects.

Updated July 13th,  2012.

  Visitor number: