import numpy as np
from astropy.stats import sigma_clip
from astropy.modeling import models, fitting
import scipy.stats as stats
from matplotlib import pyplot as plt
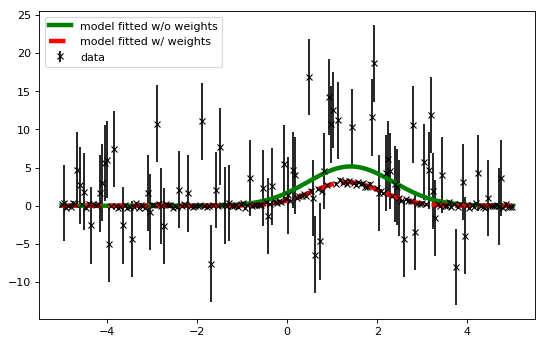
# Generate fake data with outliers
np.random.seed(0)
x = np.linspace(-5., 5., 200)
y = 3 * np.exp(-0.5 * (x - 1.3)**2 / 0.8**2)
c = stats.bernoulli.rvs(0.35, size=x.shape)
y += (np.random.normal(0., 0.2, x.shape) +
c*np.random.normal(3.0, 5.0, x.shape))
y_uncs = np.sqrt(np.square(np.full(x.shape, 0.2))
+ c*np.square(np.full(x.shape,5.0)))
g_init = models.Gaussian1D(amplitude=1., mean=0, stddev=1.)
# initialize fitters
fit = fitting.LevMarLSQFitter()
# fit the data w/o weights
fitted_model = fit(g_init, x, y)
# fit the data using the uncertainties as weights
fitted_model_weights = fit(g_init, x, y, weights=1.0/y_uncs)
# plot data and fitted models
plt.figure(figsize=(8,5))
plt.errorbar(x, y, yerr=y_uncs, fmt='kx', label="data")
plt.plot(x, fitted_model(x), 'g-', linewidth=4.0,
label="model fitted w/o weights")
plt.plot(x, fitted_model_weights(x), 'r--', linewidth=4.0,
label="model fitted w/ weights")
plt.legend(loc=2, numpoints=1)