Combining Models
While the Astropy modeling package makes it very easy to define new
models either from existing functions, or by writing a
Model subclass, an additional way to create new models is
by combining them using arithmetic expressions. This works with models built
into Astropy, and most user-defined models as well. For example, it is
possible to create a superposition of two Gaussians like so:
>>> from astropy.modeling import models
>>> g1 = models.Gaussian1D(1, 0, 0.2)
>>> g2 = models.Gaussian1D(2.5, 0.5, 0.1)
>>> g1_plus_2 = g1 + g2
The resulting object g1_plus_2 is itself a new model. Evaluating, say,
g1_plus_2(0.25) is the same as evaluating g1(0.25) + g2(0.25):
>>> g1_plus_2(0.25)
0.5676756958301329
>>> g1_plus_2(0.25) == g1(0.25) + g2(0.25)
True
This model can be further combined with other models in new expressions.
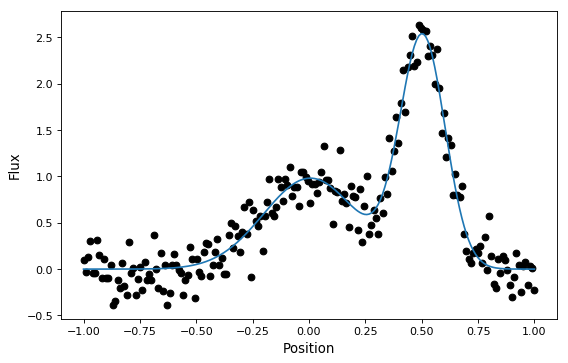
These new compound models can also be fitted to data, like most other models (though this currently requires one of the non-linear fitters):
import numpy as np
import matplotlib.pyplot as plt
from astropy.modeling import models, fitting

# Generate fake data
np.random.seed(42)
g1 = models.Gaussian1D(1, 0, 0.2)
g2 = models.Gaussian1D(2.5, 0.5, 0.1)
x = np.linspace(-1, 1, 200)
y = g1(x) + g2(x) + np.random.normal(0., 0.2, x.shape)

# Now to fit the data create a new superposition with initial
# guesses for the parameters:
gg_init = models.Gaussian1D(1, 0, 0.1) + models.Gaussian1D(2, 0.5, 0.1)
fitter = fitting.SLSQPLSQFitter()
gg_fit = fitter(gg_init, x, y)

# Plot the data with the best-fit model
plt.figure(figsize=(8,5))
plt.plot(x, y, 'ko')
plt.plot(x, gg_fit(x))
plt.xlabel('Position')
plt.ylabel('Flux')

This works for 1-D models, 2-D models, and combinations thereof, though there are some complexities involved in correctly matching up the inputs and outputs of all models used to build a compound model. You can learn more details in the Advanced Compound Models documentation.
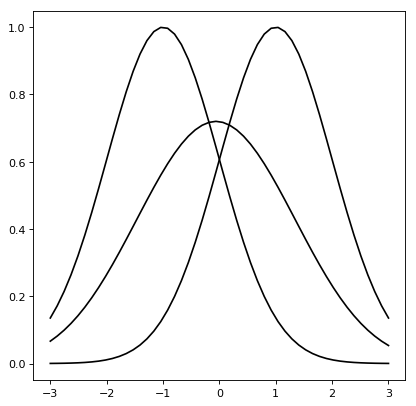
Astropy models also support convolution through the function
convolve_models, which returns a compound model.
For instance, the convolution of two Gaussian functions is also a Gaussian function in which the resulting mean (variance) is the sum of the means (variances) of each Gaussian.
import numpy as np
import matplotlib.pyplot as plt
from astropy.modeling import models
from astropy.convolution import convolve_models

g1 = models.Gaussian1D(1, -1, 1)
g2 = models.Gaussian1D(1, 1, 1)
g3 = convolve_models(g1, g2)

x = np.linspace(-3, 3, 50)
plt.plot(x, g1(x), 'k-')
plt.plot(x, g2(x), 'k-')
plt.plot(x, g3(x), 'k-')