TO: Distribution
FROM: Vega team:
Martin Zombeck, sec'y, Jeremy Drake, Marco Barbera, Yousaf Butt, F. Rick Harnden,
Brad Wargelin
SUBJECT: Vega calibration observations
DATE: 12/23/99
The following is a preliminary report on the analysis
of the Vega observations.
1.0 Introduction
The purpose of the Vega calibration observations
was to determine the UV susceptibility of HRC-I and HRC-S. In
order to accomplish this Vega was positioned at the center of
HRC-I and at four locations on HRC-S in order to sample the four
different thicknesses of HRC-S' UVIS. The geometrical
layout of the UVIS's can be found at http://hea-www.harvard.edu/HRC/overview/overview.html#focalplane.
Vega (a Lyr;
A0V; U=0.02, B= 0.03, V= 0.03; a(2000)
= 18h 36m 56.2s , b(2000)
= +38o 47' 01") is not an X-ray emitter as demonstrated
by its non-detection by the ROSAT PSPC. It is, however, a bright
UV emitter and is a suitable object to test the UV response
of the HRC detectors. On day 301 of 1999 (October 28, 1999) five
approximately 3 ks observations of Vega were carried out in order
to determine the HRC detectors' UV susceptibility. These observations
are summarized in Table 1.
Table 1. Summary of Vega observations.
| OBSID | Start Time* | Exp. Time | Detector | UVIS Segment | Count Rate** |
| 1415 | 301:15:14:09 | 3306 | HRC-I | HRC-I | < 1.4 x 10⁻³
and > 1.2 x 10⁻⁵ |
| 1416 | 301:16:17:29 | 3178 | HRC-S | Seg0 thick Al | 0.17 +/- 0.01 |
| 1417 | 301:17:20:49 | 3477 | HRC-S | Seg0 thin Al | 240 +/-0.4 |
| 1418 | 301:18:24:09 | 3291 | HRC-S | Seg+1 thin Al | 475 +/-0.7 |
| 1419 | 301:19:27:29 | 3265 | HRC-S | Seg+1 thick Al | *** |
* 28 October 1999
** Corrected for dead time losses. *** Chandra was mis-pointed
and Vega was not within the FOV.
The properties of the UVIS's are shown in Table 2.
Table 2. Properties of the UVIS's.
| Detector | UVIS Segment | Polyimide (A) | Aluminum (A) |
| HRC-I | HRC-I | 5520 +/- 193 | 763 +/- 28 |
| HRC-S | Seg0 thick Al | 2750 +/- 118 | 793 +/- 18 |
| HRC-S | Seg0 thin Al | 2750 +/- 142 | 307 +/- 30 |
| HRC-S | Seg+1 thin Al | 2090 +/- 140 | 304 +/- 20 |
| HRC-S | Seg+1 thick Al | 2125 +/- 162 | 1966 +/- 64 |
2.0 The Results
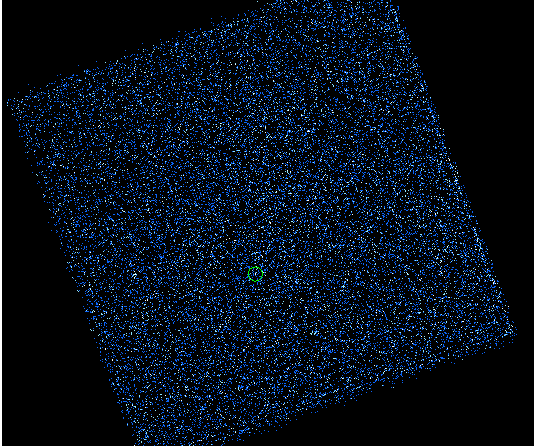
OBSID 1415 (HRC-I)

Table 1 gives the start and exposure times for the observation.
Vega was approximately on-axis. There was 1 event at the expected
location of Vega and an unknown source about 5 arc minutes off-axis. Using the technique of Kraft, et al.
in Determination of Confidence Limits for Experiments with
Low Numbers of Counts, we obtain an upper limit for the Vega
count rate of 1.4 x 10⁻³ evt s-1 (2s)
and a lower limit of 1.2 x 10⁻⁵ evt s-1
(2s
). The total primary science rate (1415time.gif or 1415time.ps)for the observation was 45
evt s-1 and the valid event rate was 45 evt
s-1. The pulse height distribution (1415pha.gif or 1415pha.ps)for the
entire detector shows a broad spectrum with a peak at approximately channel 80. There
is one source (1415regions.gif or 1415regions.ps) visible in the field with 34 net counts about 5 arc minutes off-axis: a(2000)
= 18h 36m 59s.1 d(2000)
= 38o 42' 7" with a count rate of 1.0 +/- 0.2
x 10-2 evt s-1. This source was seen by
ROSAT; an optical counterpart could not be found after a cursory
search through the SIMBAD catalog.
OBSID 1416 (HRC-S)
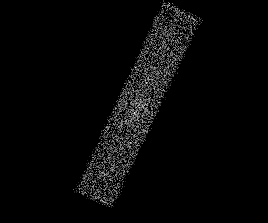
Table 1 gives the start and exposure times for the
observation. Vega was placed on the thick Al part of the central
segment (Seg 0) of the HRC-S UVIS and was approximately on-axis.
The Vega event rate was 0.17 evt s-1 (1416regions.gif or 1416regions.ps). The total primary
science rate (1416time.gif or 1416time.ps) for the observation was 50 evt s-1 and
the valid event rate was 50 evt s-1.
The pulse height distribution (1416pha.gif or 1416pha.ps) shows a peak at approximately
channel 95.
OBSID 1417 (HRC-S)
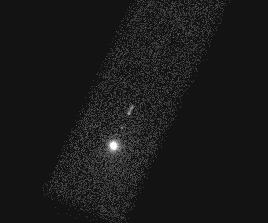
Table 1 gives the start and exposure times for the
observation. Vega was placed on the thin Al part of the central
segment (Seg 0) of the HRC-S UVIS and was approximately 10 arc
minutes off-axis. The observed Vega event rate was 138 evt s-1.
The total primary science rate (1417time.gif or 1417time.ps) for the observation was saturated
at 184 evt s-1 and the the valid event rate was 320
evt s-1. Thus the dead-time corrected image
rate is (320/184) x 138 = 240 evt s-1 . The
pulse height distribution shows a peak at approximately channel
80.
Three faint "ghosts" can be seen in the
image (1417regions.gif or 1417regions.ps), labeled B, C, and D with count rates of about 0.3%, 0.3%,
and 0.1% of the Vega image, respectively. C and D have pulse height
distributions (1417pha.gif or 1417pha.ps) similar to Vega but the distribution of B is broader,
appearing to be a composite of peaked distribution slightly higher
in pulse height than the Vega distribution and a background-like
component. We are investigating the cause of these "ghosts".
OBSID 1418 (HRC-S)
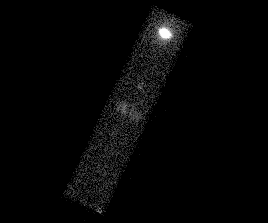
Table 1 gives the start and exposure times for the
observation. Vega was placed on the thin Al part of the wing
segment (Seg +1) of the HRC-S UVIS and was approximately 20 arc
minutes off-axis. The observed Vega event rate was 159 evt s-1.
The total primary science rate (1418time.gif or 1418time.ps) for the observation was saturated
at 184 evt s-1 and the valid event rate was 550 evt
s-1. Thus the dead-time corrected image rate
is (550/184) x 159 = 475 evt s-1 . The
pulse height distribution shows a peak at approximately channel
95.
Three faint "ghosts" can be seen in the
image (1418regions.gif or 1418regions.ps), labeled B, C, and D (actually 2 small images) with count
rates of about 1%, 0.5%, and 0.02% of the Vega image, respectively.
B and C have pulse height distributions (1418pha.gif or 1418pha.ps) similar to Vega but the
distribution of D, while peaked, has a peak pulse height about
half that of Vega. We are investigating the cause of these "ghosts".
OBSID 1419 (HRC-S)
Table 1 gives the start and exposure times for the
observation. Vega was to be placed on the thick Al part of the
wing segment (Seg +1) of the HRC-S UVIS but this was not accomplished.
The total primary science rate (1419time.gif or 1419time.ps) for the observation was 70 evt
s-1 and the valid event rate was 70 evt s-1.
Although there is no main image, three faint "ghosts"
can be seen in the image (1419regions.gif or 1419regions.ps), labeled B, C, and D with count rates
of 2%, 1%, and 0.5% of the total rate, respectively. All the pulse
height distributions (1419pha.gif or 1419pha.ps) are peaked with the peak pulse heights
slightly higher than channel 100. We are investigating the cause
of these "ghosts".
3.0 Comparison of Observed Count Rates with the Model
Predictions
The expected count rates for the 5 Vega observations
were calculated by convolving the Vega UV-visible spectrum with
the modeled effective areas for the various regions of the detectors
and making a correction for vignetting (0.85 @ 10 arc minutes,
0.70 @ 20 arc minutes).
Table 3 provides a summary of the results and provides
links to plots of the effective areas and to comprehensive reports
of the modeling calculations.
Table 3. A Comparison of Observed Count Rates for
Vega with Model Predictions.
| OBSID | Detector | UVIS Segment | Obs. Count Rate* | Pred. Count Rate*** | Eff. Area
Model | Model
Report |
| 1415 | HRC-I | HRC-I | < 1.4 x 10⁻³
and > 1.2 x 10⁻⁵ | 7.4 x 10⁻⁴ | hrci_uv | uv |
| 1416 | HRC-S | Seg0 thick Al | 0.17 +/- 0.01 | 0.9 | uv0thick | uv0thick |
| 1417 | HRC-S | Seg0 thin Al | 240 +/-0.4 | 391 | uv0thin | uv0thin |
| 1418 | HRC-S | Seg+1 thin Al | 475 +/-0.7 | 1960 | uv1thin | uv1thin |
| 1419 | HRC-S | Seg+1 thick Al | ** | 1.4 x 10⁻⁶ | uv1thick | uv1thick |
* Corrected for dead time losses. ** Chandra was mis-pointed and Vega was not within the FOV.
*** Corrected for vignetting
4.0 Conclusions
Given the crudeness of the UV-visible detector response models, the agreement (factors of 2 - 4) between predicted and observed rates is remarkable. We still need to explain the "ghosts" but as far as the purpose of the observations is concerned we have demonstrated that the detectors pass the "Vega test". Although we failed to test the thick Al part of Seg 1, our expectations are that we would have obtained a null result, since the predicted rate is so low. The ROSAT HRI Vega rate was 0.1 evt s-1. The mirror area was almost identical to the HRMA and the detector also had a CsI photocathode. Our HRC-I UVIS shield has reduced the UV-Visible light contamination from Vega by a factor of at least 75 compared to ROSAT.