M87's Shock
The 500 ksec Chandra observation showed that the supermassive black hole in M87 has driven a classical shock into the surrounding intracluster gas. We observe a nearly circular ring whose gas density and gas temperature jumps independently yield the same Mach number.
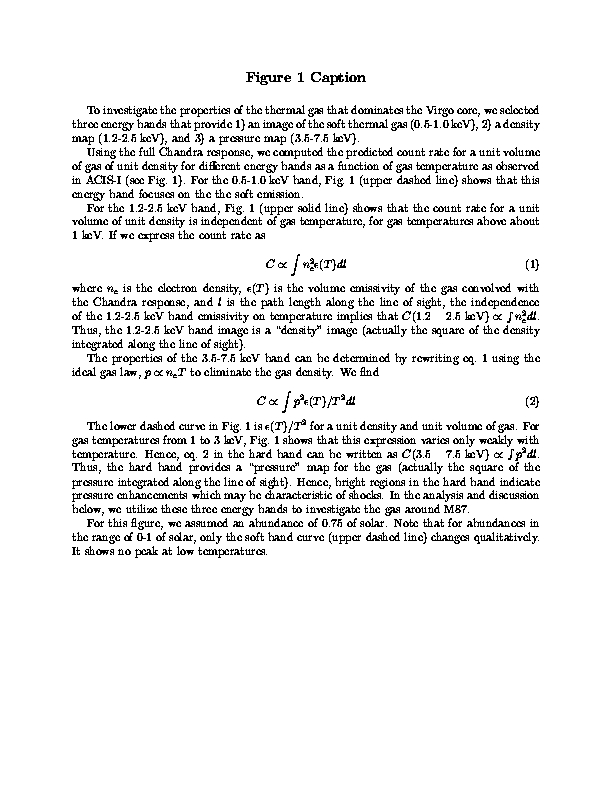
We begin by selecting three energy bands for detailed analysis. The three energy bands are 0.5-1.0 keV, 1.2-2.5 keV, and 3.5 -7.5 keV. These three bands emphasize different characteristics of the hot gas surrounding M87.
Fig. 1 shows the Chandra response to gas as a function of temperature for 3 different energy bands.
|
Fig. 1 shows the Chandra count rate as a function of temperature for three energy bands. The 0.5-1.0 keV band (upper dashed red curve), with the peak below 1 kev, emphasizes soft/cool emission. The 1.2-2.5 keV band (upper solid, black curve) shows no variation above 1 keV, and thus, provides a "density" image of gas around M87. The 3.5-7.5 keV band (lower solid blue curve) does vary with temperature. If we write the count rate in terms of T and P (using the ideal gas law) we find that all but the pressure terms are nearly constant (lower dashed green curve). Hence, the hard band provides an image of the gas pressure and is ideal for detecting shocks. More Details |
For the 0.5-1.0 keV band, (upper dashed line, red) shows that this energy band focuses on the the soft emission. For the 1.2-2.5 keV band (upper solid line, black) the count rate for a unit volume of unit density is independent of gas temperature, for gas temperatures above about 1 keV. The count rate depends on the projected square of the gas density. Therefore, the 1.2-2.5 keV band is a ``density'' image (actually the square of the density integrated along the line of sight). Similary, the 3.5-7.5 keV band can be shown to be a ``pressure'' image (square of the pressure integrated along the line of sight). While the count rate in the hard band is represented by the lower solid (blue) curve, the count rate, CR, can be written as CR ~ p^2 e(T) T^2. The lower dashed curve (green) shows that e(T) T^2 is nearly constant with temperature around 2 keV and hence CR ~ p^2. Hence, bright regions in the hard band indicate pressure enhancements which may be characteristic of shocks.
M87 in the Hard Band: Imaging a Shock
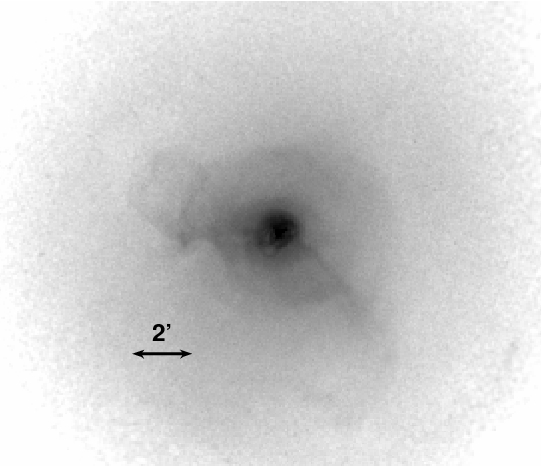
The deep Chandra observation provides a high quality image in the 3.5-7.5 keV band.
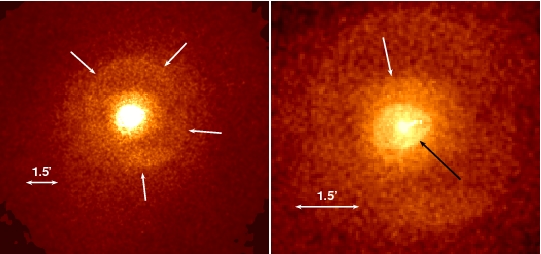
For the first time, we are able to IMAGE the over pressurized regions of hot gas. We see three discontinuities, or edges, in the gas pressure. The left image shows the main outer shock (2.8', white arrows) We see a nearly complete ring of enhanced pressure, a weak shock propagating through the hot gas around M87. The right images show two disturbances at smaller radii (1', white and 0.6', black arrows). Similarly, the 1.2-2.5 keV band image maps the gas density around M87 (as mentioned above, really the square of the density, projected along the line of sight).
The fundamental idea is that outbursts, ultimately powered by accretion onto the supermassive black hole in the galaxy nucleus, provide energy to the surrounding hot gas. Some energy is provided as shocks directly heat the gas while, at least for M87, the bulk of the energy is provided as the buoyant, plasma filled cavities inflate and rise (see movie) through the gaseous atmosphere. A simulation, tailored for the Perseus cluster, shows 1) the density perturbations as outbursts inflate bubbles and rise through the gas and 2) the heating (dark regions) from the periodic weak shocks driven as the bubbles inflate.
Classical Shock Parameters from the Gas Density and Gas Temperature
By combining the observations from different bands, we can derive both the gas density and gas temperature as a function of radius. The change in density and temperature at the shock each provide independent measures of the Mach number of the shock using the Rankine-Hugoniot shock jump conditions.
We begin by deriving the gas density and gas temperature profiles.
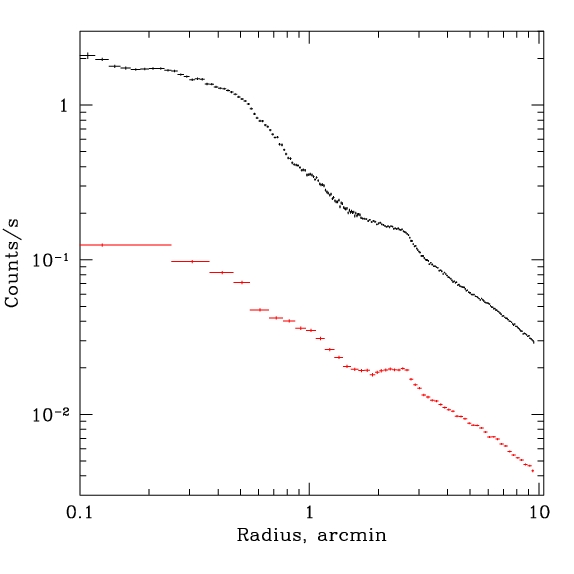
The left hand figure shows the radial profiles derived from the 1.2-2.5 keV (upper, black) and 3.5-7.5 keV (lower, red) band images.
The left hand figure shows the radial profiles derived from the
1.2-2.5 keV (upper, black) and 3.5-7.5 keV (lower, red) band images.
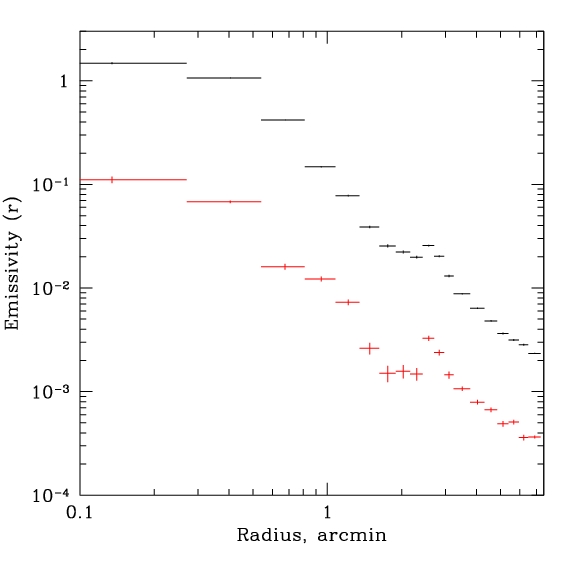
The right hand figure shows the deprojected emissivities in the two
bands. Both radial profiles show the very prominent feature at 2.8'
(13kpc). Weaker features are seen at 0.6' and 1' (as already noted in
the hard band image).
The 1.2-2.5 keV band directly gives the gas density profile. The
combination of the two energy bands provides a measure of the gas
temperature.
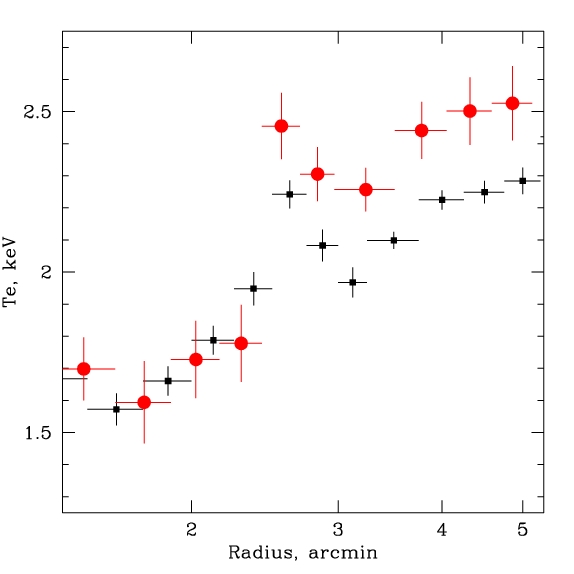
The derived temperature profile (red, northern sector alone; black, complete azimuthal average) also shows the temperature discontinuity at 2.8' (13 kpc).
Using the temperature and density profiles, we measure the temperature and density increases produced by the passage of the shock. The temperature increases by a factor of 1.18+-0.03 and the density increases by a factor of 1.33+-0.02. These measured "jumps" can be used with the Rankine-Hugoniot shock jump equations to derive the Mach number of the shock.
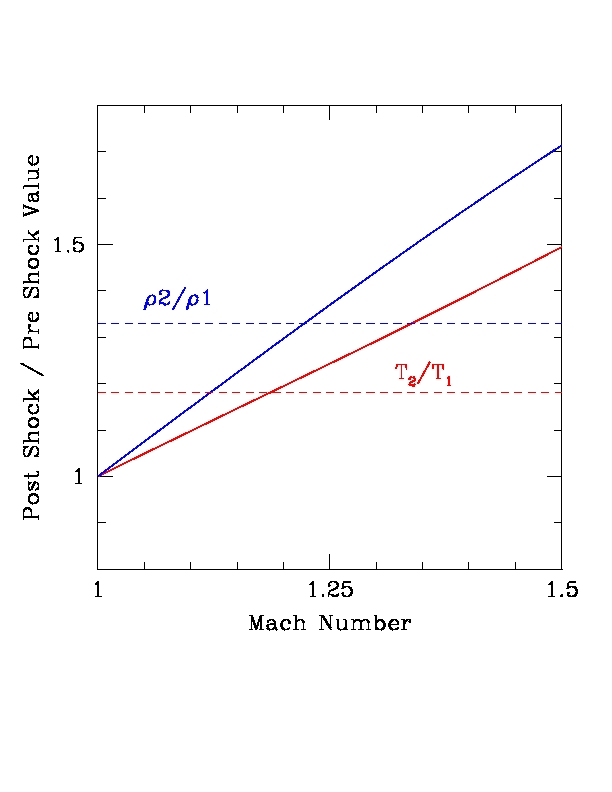
The Rankine-Hugoniot temperature equation is the solid blue line and the density equation is the red line. The measured values are represented by the horizontal dashed lines - red is temperature and blue is density. The intersection of the red lines yields the Mach number for derived from the gas temperature jump while the intersection of the blue lines yields the Mach number derived from the density jump. Both determinations lie between 1.20 and 1.25. The near equality of the two independently determined values of the Mach number support the interpretation of the 2.8' ring as a classical shock.
In conclusion, the Chandra observations of M87 show a nearly circular ring at a radius of 2.8' (13kpc) whose properties are consistent with that of a (weak) classical shock with a Mach number of about 1.2.
Next: The Piston Driving the Shock