XTE J1118+480
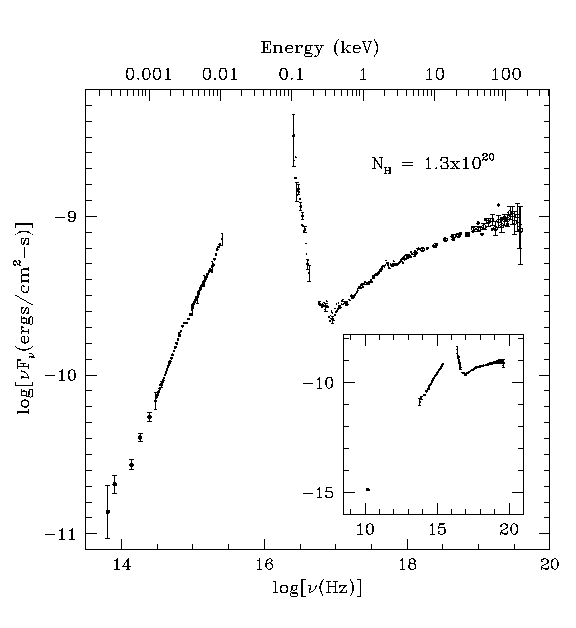
The SED of J1118+480 corrected for the adopted
column depth of N$_{\rm H}~= 1.3~\times~10^{20}$~cm$^{-2}$.
(1) The UKIRT flux densities
reported by Hynes et al. (2000) have been multiplied by 0.8 to force
them to approximately match the {\it HST} spectrum; the discrepancy may be
due to the short UKIRT exposures and the rapid optical variability of
the source (Patterson 2000). (2) The {\it HST} data were dereddened
(Cardelli, Clayton \& Mathis 1989; Predehl \& Schmitt 1995). No ad hoc
corrections have been applied to these data; error bars are plotted on
every eighth point. (3) The {\it EUVE} data become quite uncertain near the
lowest energy (0.10 keV); error bars are displayed on approximately
every third data point. (4) The {\it Chandra} LETG spectrum has very small
statistical errors; error bars are drawn on every tenth data
point. The spectrum shown here is truncated at 6 keV; otherwise, no ad
hoc corrections have been made to this spectrum. (5) The {\it RXTE} data
begin at 3 keV and thus overlap substantially with the LETG spectrum.
The small filled circles without error bars show the spectrum for
April 18. The summed spectrum (\S3) is plotted as open circles with
error bars. The statistical significance of the last two data points
in the summed spectrum are 3.8$\sigma$ at 154 keV and 2.8$\sigma$ at
162 keV. Since Crab observations indicate that {\it RXTE} systematically
produces fluxes that are high by about 15\% and since some modest
variability is expected, the fluxes for April 18 were multiplied by
0.84 to match the overlapping LETG fluxes; similarly, the
summed-spectrum fluxes were multiplied by 0.91.
From McClintock et al. ApJ, 555, 477, 2001.
X-ray power-law emission from J1118+480 explained as optically thin synchrotron emission
from a shock acceleration region in the innermost part of the jet, with a
cutoff determined by cooling losses.
Fit to data from Hynes, Mauche, & Haswell (ApJ 539, L37 2000); Hjellming et al. (private comm.);
the Ryle Telescope and a non-simultaneous JCMT point (Fender MNRAS, 322, 31, 2001).
Included is a schematic indicating the different emission components.
From Markoff, Falcke, & Fender, A&A, 372, L25, 2001.