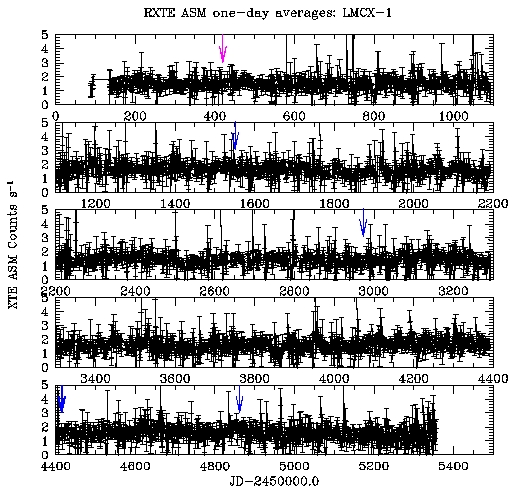
RXTE/ASM lightcurves of LMC X-1. Red arrows are radio observations, magenta arrows are optical observations, yellow arrows are ultraviolet observations, green arrows are extreme ultraviolet, blue arrows are x-ray observations, and cyan arrows are gamma-ray observations. Compiled by Emma Rosenfeld of Medfield High School, July 28, 2009.
Updated by Harry Hausner of Gann High School on July 7, 2010 `.
RXTE—
	15 observations of length greater than 10,000 s
	Time range: 1996-08-11 16:06:10.1 to 2004-01-12 06:12:06.6
		2450307.171 to 2453016.758
ASCA—
Date; J. Date					gis exposure			sis exposure
1993-09-23 22:48:28; 2449254.450		 41472	 			37248
1995-04-02 23:24:09;	2449810.475		 22304				11840
1994-10-11 06:24:51; 2449636.767		 12960	 			7712
1994-09-30 22:58:14; 2449626.457		12736				8800
1994-10-12 14:14:43; 2449638.094		10560	 			4992

Swift Master—
Date; J. Date					xrt exposure			uvot exposure
2007-11-11 01:08:01; 2454415.547		16434.200			0.000
2007-11-09 01:07:01; 2454413.547		11418.400			0.000
2009-01-30 05:35:01; 2454861.733		10833.700			10826.838

IUE—
	6 observations of length greater than 10,000 s
	Time range: 1980-05-09 08:56:26 to 	1985-07-11 07:56:32
		2444368.873 to 2446257.831

CGRO/COMPETEL—
	11 observations of length greater than 250,000
	Time range: 1991-05-10 22:06:14.4 to 1993-08-17 22:55:12
		2448387.421 to 2449217.455

Chandra—
Date; J. Date				exposure		instrument	grating
2003-12-08 22:37:59;	2452982.443	21130 			ACIS-S	NONE
2000-01-16 04:09:58; 	2451559.674	19170 		ACIS-S	HETG

RXTE/ASM lightcurves of LMC X-1. Arrows indicate times of
X-ray observations. Compiled by Melissa Warstadt July 6, 2007.
Updated by Harry Hausner June 22nd, 2010.
