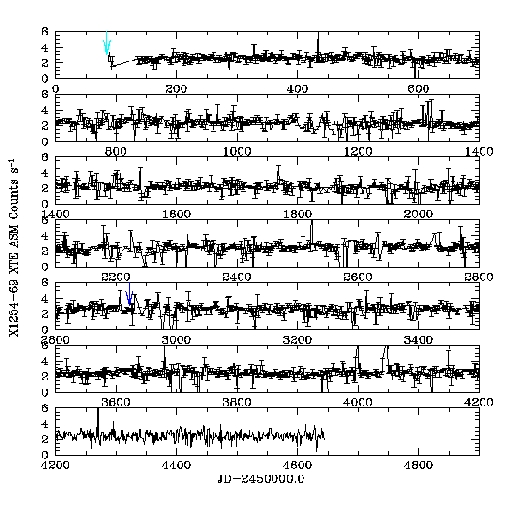
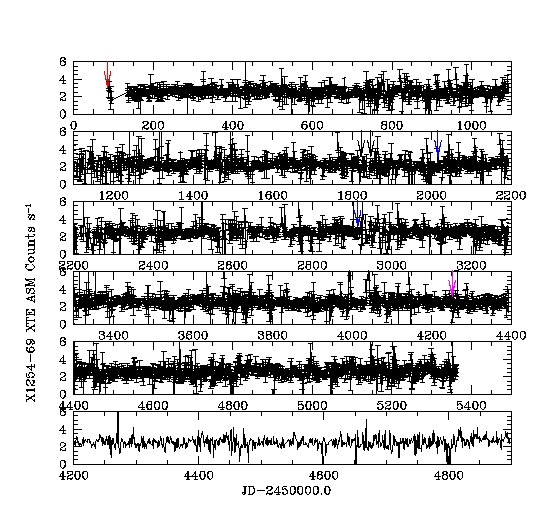
RXTE/ASM lightcurves of 1254-69. Red arrows designate ISO observation times. Thick blue arrows designate Chandra observation times. Magenta arrows designate Swift XRT and UVOT observation times. Black arrows designate unidentified observation times. Compiled by Emma Rosenfeld of Medfield High School, July 20 2009. Updated by Harry Hausner, July 1, 2010.
RXTE – 19 observations of length greater than 10,000 s
	Time range: 1997-04-28 22:55:26.7 to 2008-01-23 03:34:02.5
		2450567.455 to 2454488.648

Chandra-
Date; J. Date				detector	grating		exposure
2003-10-10 01:57:40; 2452922.581	ACIS-S	HETG		52940

Swift—
Date; J. Date					xrt exposure		uvot exposure
2007-06-10 01:54:00; 2454261.579		10971.500		11017.675

RXTE/ASM lightcurves of 1254-69. Blue arrows designate X-ray (Chandra)
observation times. Cyan arrows designate Gamma ray (CGRO)
observation times. Compiled by Taylor Sipple of Medfield High School, July 3, 2008.
nstrument	Start Date	Time on source (s)	Julian Date
Chandra	2003 OCT 10 01:57:40	52940	2452922.581712963 UTC

CGRO/OSSE	1994 JAN 03 12:05:45.6	86054.4	2449356.004 UTC
CGRO/OSSE	1994 JAN 03 12:05:45.6	1209600	2449356.004 UTC
CGRO/OSSE	1994 JAN 16 12:05:45.6	690163.2	2449369.004 UTC
CGRO/OSSE	1994 JAN 23 12:05:45.6	85363.3	2449376.004 UTC
CGRO/OSSE	1995 DEC 20 12:05:45.6	87091.2	2450072.004 UTC
CGRO/OSSE	1995 DEC 20 12:05:45.6	1209600	2450072.004 UTC
CGRO/OSSE	1996 JAN 02 12:11:31.2	86054.4	2450085.008 UTC

