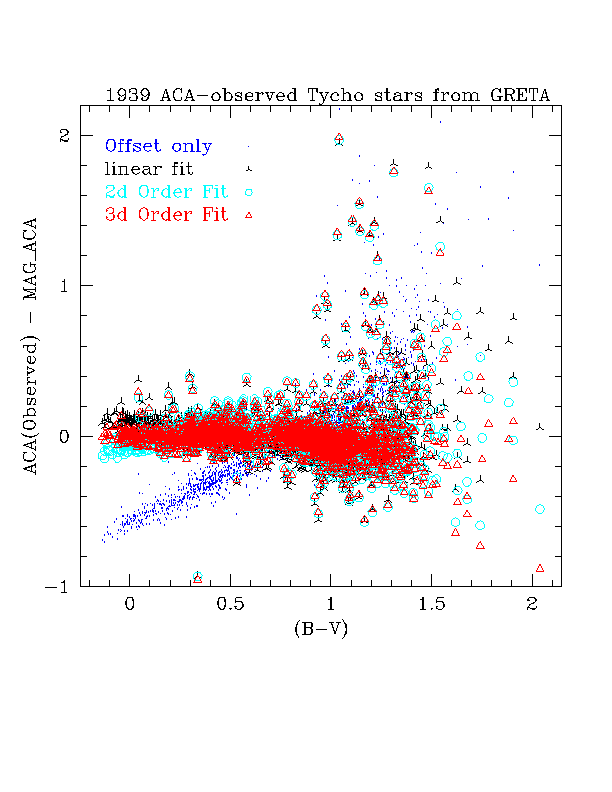
Statistics are as follows for 1939 ACA-observed stars using the 3d order fit:
See /data/mp2/ACA_cal/apr01/ for data, code, and notes.
This file is /proj/asc/www/LOCAL/mp/html/agasc1p5.html
Inclusion of Tycho2 data to a completeness limit of V=11.5 (rather than the previous V=10 limit of Tycho) will significantly lower the magnitude and position errors on an additional 1.5million stars in AGASC. The most significant improvement in ACA magnitude estimates results from the accurate tabulated colors available.
We also have the opportunity to recalibrate the AGASC magnitude estimates using a larger number of observed ACA magnitudes. Using a GRETA script, flight ACA data were extracted for about 8400 stars observed with the ACA from 1999-Sep to 2000-Oct. (Thanks to Jeff Shirer for creating and running the script). These data were then correlated by Tom Aldcroft with CXC Level 1 aspect products to determine AGASC catalog information for each star. Approximately 5700 stars were thus identified. These data showed that there was no mean offset between observed and AGASC1.4 catalog magnitudes. Neither was there any correlation in magnitude difference with either magnitude or time. There was however a noticable systematic residual (about +/- 0.2 mags) in magnitude difference versus (B-V) color. For details see Tom's January 2001 report.
The ACA star observations were obtained while in Normal Pointing Mode and while on Kalman filtering. We have further analyzed these data to recalibrate the estimates of MAG_ACA in AGASC1.5. Removal of repeat observations of the same star cull the above list down to 2737 unique stars with ACA observations matched to cataloged AGASC stars. 798 of those have only PPM data in AGASC1.4. PPM mags are less accurate thatn Tycho mags, and most PPM data will be replaced with data from Tycho2. However, we recalibrate the MAG to MAG_ACA conversion for Tycho stars, PPM stars and GSC1.1 stars below, as best we can with the available data.
Based on this new ACA data, I've done polynomial fits to predict ACA mags for all stars, to recalibrate the MAG_ACA values. We use the median ACA mags rather than the mean. For a primer on how MAG_ACA values are calculated, see MAG_ACA update pseudocode. Essentially, I fit (ACA - V) as a function of COLOR1. COLOR1 in Tycho is (BT-VT) where Johnson (B-V) = 0.850*(BT-VT)
New Tycho fit results are as follows:
ORDER       4th        3d           2d          1st          0th
--------------------------------------------------------------------
C0       0.456604    0.428638     0.375402     0.513502    -0.173217
C1      -1.26040    -0.774029    -0.364786    -0.889533
C2       1.69743     0.283002    -0.354679
C3      -1.61554    -0.267284
C4       0.402788
X^2(red) 0.04014     0.040665     0.041344     0.045255    0.169381
--------------------------------------------------------------------
                     AGASC1.5
The difference between AGASC1.5 magnitudes and observed ACA
magnitudes as a function of Johnson (B-V) color for this sample of
1939 is shown below. I've chosen the cubic polynomial fit for
AGASC1.5. Overall, the residuals are not much worse than the 4th
order fit, but the cubic actually looks better at the blue end.

Statistics are as follows for 1939 ACA-observed stars
using the 3d order fit:
          OBSERVED  NEW CALC  TYCHO   COLOR1  NEW-OBSERVED
          ACA MAG   ACA MAG    MAG              MAG DIFF
 MED       9.125     9.131    9.364    1.002    -0.013
 MEAN      8.896     8.896    9.139    0.908     0.000
 SIGMA     0.888     0.869    0.938    0.466     0.202
 MIN       5.750     6.017    5.800   -0.161    -2.107
 MAX      10.688    10.860   10.986    2.399     1.988
 RANGE     4.938     4.843    5.186    2.560     4.095
Analysis of the distribution of AGASC1.5 magnitude differences for these stars shows that they are non-gaussian. The absolute value of magnitude difference was distributed as follows:
68%    < 0.085 mags
95%    < 0.3   mags
99.7%  < 1.5   mags
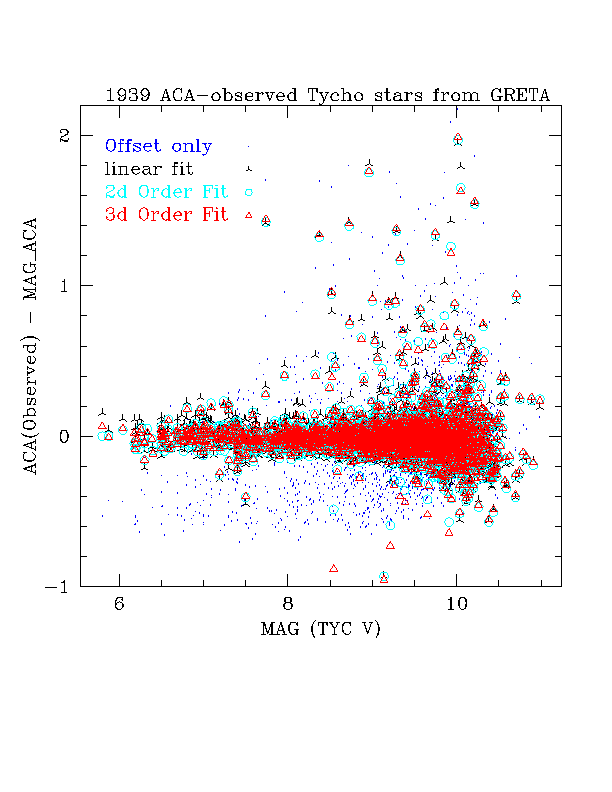
Finally, the new fit shows no signs of being magnitude dependent:

Important points:
If any MAG values listed in AGASC1.5 are from the PPM catalog, they may have crude colors based on spectral type (see earlier AGASC documentation).
New PPM fit results are as follows:
ORDER       4th        3d           2d          1st          0th
--------------------------------------------------------------------
C0       0.381712    0.389887     0.478573     0.717156     0.238356
C1       1.10085     0.922156     0.221899    -0.677880
C2      -2.13413    -1.60675     -0.550461
C3       0.891056    0.407737
C4      -0.135640
X^2(red) 0.164025    0.163930     0.167331     0.185935    0.287951
--------------------------------------------------------------------
                     AGASC1.5
4th order worsens the fit, and 3d order is an insignificant
improvement, so we choose the 2d order fit.
C0= 0.478573,
C1= 0.221899,
C2= -0.550461
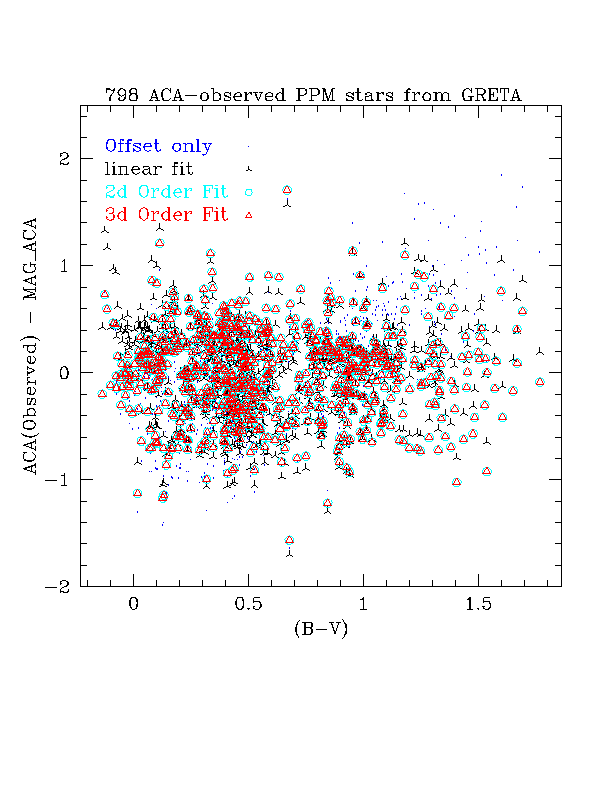
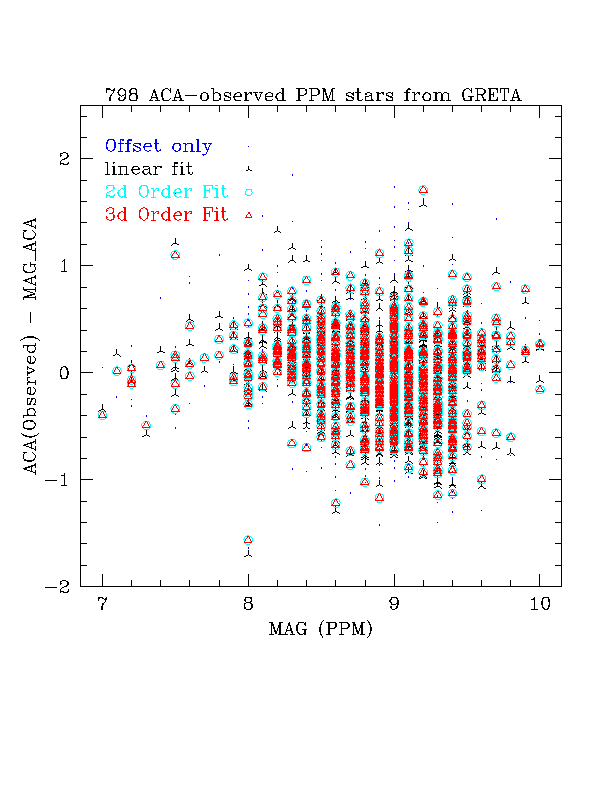
Even so, the scatter is large, given that the color information is poor.
 Below you can see how the PPM colors form a picket fence,
since each spectral subtype listed in the PPM was assigned
a corresponding color.

Finally, the poorest data, for the fainter stars, comes only from the HST GSC1.1, which has NO color information. Firstly, the MAG listed in GSC1.1 is in several different bandpasses. We attempt a conversion to V mag using an assumed typ[ical color of (B-V)=0.7 along with the conversion values provided (see earlier AGASC documentation). It is worthwhile to convert to V mag from the various GSC mags:
           ACA-MAG  ACA-V
 NUM        2691     2691
 MED      -0.128   -0.077
 MEAN     -0.148   -0.063
 SIGMA     1.194    1.153
 MIN      -4.962   -4.458
 MAX       4.072    3.967
 RANGE     9.034    8.425
Below you can see how the derived V mag appears to be
virtually uncorrelated with the observed ACA mag.
 We cannot examine and fit the difference between observed
ACA mag and V mag as a functino of color, since we have no
color information. However, taking the difference between the observed
ACA mag and the GSC1.1 V mag shows a strong trend with magnitude.

Stellar Surface Density The average stellar surface density of unspoiled stars brighter than MAG_ACA=10.2 with color information ((ASPQ1=0, CLASS=0, C1_CATID.ne.0) is 9.5 stars per square degree in AGASC1.4 Near the galactic poles (b>80deg), where the stellar surface density is lowest, there are 4.1 stars per square degree. The desired figure of merit (FOM) of 5.1 per square degree over 95% of the sky is thus not quite achievable with these selection criteria from current catalogs, and may not ever be (i.e. we are already nearly complete). The current Chandra guide star selection includes stars without TYC colors or PPM SpType information, which boosts the surface density, but at this limiting ACA magnitude, such colors are available for 98% of stars.
 b1	b2	Nstars  Ndeg^2	stars/deg^2
		w/colors	w/colors
----  -----     -----   -----   --------------
 80	90	1285	313.3	4.10
 55	65	8405	1797	4.68
 25	35	24951	3113	8.02
-90	90	393623	41253	9.54
Changes in Selected Guide Stars from AGASC1.3 A key measure of the effects of this update is the change in selected stars between AGASC1.3 and AGASC1.4. Roughly 1/3 of the Cycle 1 observations will have different star sets chosen by the CXC MP Star Fidlight Evaluator (mp_sfe) for the new AGASC 1.4 mags. How do the stars chosen in these fields differ?
All Fields	AGASC1.3	AGASC1.4
		---------	---------
mean mag:	8.448		8.630
mean fom:	0.15308		0.31221
min fom:	0.13669		0.13721
max  fom:	0.32571		0.32755

Number of
guide stars:	AGASC1.3	AGASC1.4
		---------	---------
5		634  (94.9%)	 610  (91.3%)
4		 22  ( 3.3%)	  33  ( 4.9%)
3		  9  ( 1.3%)	  17  ( 2.5%)
3		  3  ( 0.4%)	   8  ( 1.2%)
FOMs and the number of suitable stars per field brighter than MAG_ACA=10.2 looks slightly worse in AGASC1.4 Since AGASC1.4 is simply more realistic, that's nature's fault, not ours. Here's the breakdown on the number of individual target fields whose stars change between AGASC1.3 and AGASC1.4:
0 stars changed: 434 ( 65.0%)
1 stars changed: 175 ( 26.2%)
2 stars changed:  47 (  7.0%)
3 stars changed:  12 (  1.8%)
4 stars changed:   0 (  0.0%)
5 stars changed:   0 (  0.0%)

total fields analyzed:  668
total stars analyzed:	3285