The analysis of this case has progressed and expanded. A general overview of the major issues surrounding this case can be found on the LandisCase Wiki, where the Internet analysis of the Floyd Landis case are being summarized.
[skip to the good part]
I've been a critic so far of the theory behind the isotope ratio test used to "prove" Floyd Landis' guilt. From the start, I felt that since we are what we eat, our diet could have a significant and rapid impact on the metabolites of our various natural steroids. I've written about this quite a bit in my first article on this topic. There's also a lot of general information there that I'm not going to review here, so it's worth a read.
At first, I could only find the abstract of the results: http://www.bgc-jena.mpg.de/service/iso_gas_lab/gasir2005/GasiR_2005_Program_and_Abstracts.pdf from the October 2005 GasiR conference, where the results were apparently presented, under the name "Influence of Dietary Changes on the Dynamics of 13C/12C in Selected Urinary Steroids", by Ulrich Flenker, Carsten von Kuk, Frank Hülsemann, Vassilios Gougoulidis, Ute Güntner and Wilhelm Schänzer. But now, I've found a set of slides from a presentation of this study. I'm not sure when this was presented - one might guess at the GasiR conference where the abstract is mentioned, and where a presentation is also mentioned. However the date in this document (from Document Properties in Acroread) was after this time.
I still have not found any published paper for this study. The presentation is the best I have for results from that study. This article is an analysis of that presentation, what it means to my original theory, and more importantly, what it means to Floyd Landis and cycling.
To sum up, they studied six individuals (only the data from five is presented) before, during, and after a 28 day period where their diet was changed to a diet that incorporates lots of C-4 plants. Five metabolites were sampled regularly (based on the presented data, more or less daily). They measured the isotope ratio for Androsterone and Etiocholanalone, which are testosterine metabolites, and would be the compounds targeted for suspicious changes in an athlete. They also measured three compounds that can be used as references, that is they are assumed to be constant whether an athlete dopes or not. These were 11-OH-Androsterone, 11-OH-Etiocholanalone (which are metabolites of cortisol), and Pregnanediol (which is a metabolite of Progesterone).
They claim that what they found was that while diet had a clear influence, it could not affect the results enough to cause a false positive, which would be a difference between the target and the reference of three per mil or greater. However, a close study of their data clearly demonstrates that during this study, at least two of their subjects had two or more measurements of differences greater than three per mil!
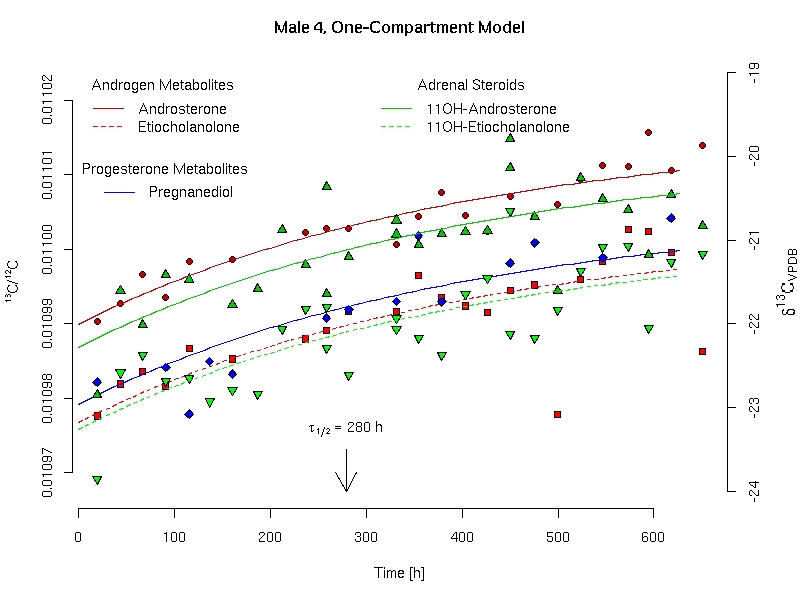
The tenth page of the presentation is a graph labelled "Male 4, One-Compartment Model", and I've included it here. You can see what I mean about dietary changes having a gradual effect. However, look at how much the values bounce up and down. At around 500 hours, The Androsterone and Etiocholanalone are about 2.5 per mil apart. The particularly odd thing here is that these two metabolites allegedly both come from testosterone. If the error for these measurements is around 0.3 or 0.5 per mil, as I've seen reported other places, then how can these two compounds diverge so much?
Certainly it can be observed that Etiocholanalone is always lower than the Androsterone. It isn't hard to imagine that the different chain of events required to create these two metabolites results in some exchange of carbon atoms, and therefore differing isotope ratios. But shouldn't this be relatively constant? Obviously this is not the case.
[A=Androsterone, E=Etiocholanalone, OHA=11-OH-Androsterone,
OHE=11-OH-Etiocholanalone, P=Preganediol]
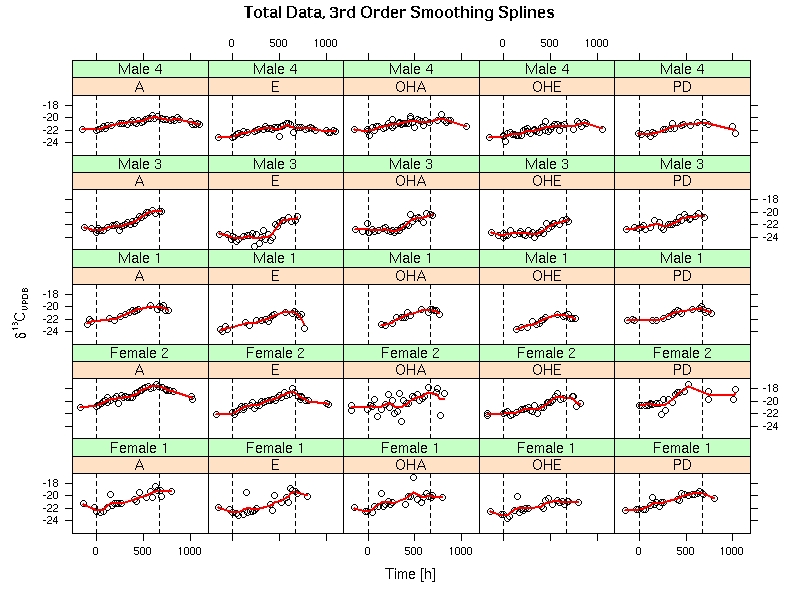
The chart from the 12th page of the presentation, labelled "Total Data, 3rd Order Smoothing Splines" contains a graph of each subject's values for each of their measured metabolites. This graph is shown above. As you can see, Male 4 has the most stable results, and the two Testosterone metabolites are also the most stable. And yet from the first graph we can see that there are significant apparently random variations even in Male 4.
Male 4 is the only subject where we have such detailed data points. For the rest, we have the above image. However, it is possible to extract the approximate values from these graphs, by studying them closely. I've automated this process, with a script that finds the pixel coordinates for each circle. Let me be clear at this point that the image I'm using was not rendered with a PDF reader, and then clipped from the result. This image data was extracted directly from the PDF file, and thus it has not been distorted by the rendering process.
So what did I find? Well, as far as variability goes, there are several instances where two consecutive data points vary by more than three per mil. Note that this is not what WADA tests for and does not represent a failure, however the fact that this can happen at all in subjects who are presumed to be all-natural raises extremely troubling questions about the underlying assumptions of this test.
The largest variation came from the OHA measurement for Female 2. As you can see looking at this graph, it is overall by far the most variable. We don't know what's going on here, but we have to assume it's natural, since there's nothing to indicate otherwise. Her largest variation is 28 pixels, which corresponds to approximately a change of 4.48 per mil, and it occurred across two data points which are two pixels apart in the x-axis, which corresponds to approximately one day. (Each pixel is 10.6 ± 0.1 hours wide and 0.16 ± 0.007 per mil high.)
Additionally, Female 1 had two different variations of 22 pixels, or 3.52 per mil, in her E and OHA measurements. The highest day-to-day variations found in the Male subjects were 14 pixels (2.24 per mil) for Male 1's E, and 13 pixels (2.08 per mil) for Male 3's E.
So does this mean that natural variations among men can't cause false positives? Hardly. The test's claimed strength is that by comparing two compounds, effects of diet can be eliminated. This assumes that both compounds are produced and metabolised at similar rates, of course, as I pointed out in my first article. However, it ALSO assumes that aside from diet, these things are fairly constant. If they tended to vary more or less randomly from day to day, then the comparison would prove to be a weakness, because what would happen if the random variations caused the target to drop two per mil, while the reference went up two per mil? You'd get a false positive for synthetic testosterone.
Unfortunately, the data in the graphs is not always perfectly aligned. However, I'm fairly confident, by visual inspection, that some of my automated results are accurate. In particular, Female 2's A to OHA difference is quite interesting. She's the one with the unusually high variations for OHA in the first place, so this isn't a surprise. Her results show two points where the differnce was nearly three per mil between these two compounds, and two more points with pixel differences of 24 and 25 pixels, corresponding to 3.84 and 4.0 per mil! You read that right. One of the test subjects was tested with isotope ratio differences nearly identical to Floyd Landis' failure!
The woman's Androsterone was four per mil HIGHER than her 11-OH-Androsterone, which actually almost completely EXCLUDES the possibility of doping, as synthetic testosterone should make your Androsterone isotope ratio LOWER than any reference. However, according to WADA technical document TD2004EAAS, the protocol only specifies a difference of more than three per mil indicates doping, without specifying that it be higher or lower. Do we assume that the lab technicians are aware of this subtle distinction, or might it actually be possible that Floyd's 3.99 per mil result could prove he didn't dope? I consider it highly unlikely that the testers could be so dumb, but someone needs to check that to be sure -- I also would have considered it unlikly that the testing protocol could miss this point.
There is one subject with two apparent false positives and a near miss. You may have noticed that Male 3's Etiocholanalone drops low right in the middle. Around this time, he had differences of 18, 19, and 20 pixels (2.88, 3.04, and 3.2 per mil). The larger two of these would both be positives for doping. Further, this is comparing a testosterone metabolite to Pregnanediol, which based on all the research seems to be the preferred reference compound because it is the most stable. Let me make this clear: in a study that allegedly proves that this test is safe against false positives, there were apparently two false positives!
Here are my own graphs of the differences between the reference and target compound's isotope ratios for these two individuals. The center gray line is a value of zero, that is, identical isotope ratios. Lower points indicate the target is lower than the reference in carbon-13 content. The red lines are at the three per mil doping limit, anything outside of those is a doping positive.
I'm going with the latter, all samples that match at a single point in time constitute a single test, because that's practical in this case. Floyd wasn't found 1/4 postive on four tests. He was found completely positive base on one out of four comparisons.
So what's the answer? I'm simply going to estimate that there's 25 viable samples for each rider where comparisons are possible. I think that's actually a bit generous. At any rate, it means there's 125 tests in total, and four of those were outside of the three per mil limit. This translates into a failure rate of 3.2%: one out of every 31 tests can be expected to exceed the three per mil limit without any doping!
So where does all this leave Floyd? One fact that has not been widely reported in the media, though it has been widely talked about on the internet, is that the process that Floyd Landis has begun does not allow him to ask the questions that I've raised here. These two terriffic articles by Bob Mionske at Velonews describe the process in detail: part1 part2 It boils down to this: Floyd can't try to contradict the theory or the results of the test. Or as somoeone on the Internet said, "THOU SHALT NOT QUESTION THE TEST". He can only find procedural problems that could make the test invalid, or he can explain how such a result could come to be where it wouldn't be considered doping.
Now one could argue that the result of the test is that one of his urinary metabolites differed from another by more than 4 per mil in carbon-13 concentration. If this is the "result" and he only has to explain the result, then everything presented here is to Floyd's adavantage. It's easy to explain the result, WADA's own science clearly demonstrates that natural process can cause the result, and Floyd is done.
But it's my understanding that this is impossible. The "result" is not the difference in carbon-13 concentration between his various metabolites. The "result" is that he DID HAVE synthetic testosterone in his body. In other words, the "result" is really the conclusion of the test. Now I may have thouroughly discredited that conclusion here. But if that is the unquestionable "result" of the test, then Floyd can not do what I have done. If this is the case, misapplied science will destroy Floyd Landis' career, and steal from him the greatest professional accomplishment he's achieved in his life so far.
And what about us? We still don't know whether or not Floyd doped. Outside of something bizarre like the lab not knowing the difference between three per mil higher and three per mil lower, it's pretty much impossible to prove he didn't. And of course, it's still entirely possible that he did take testosterone. So even if Floyd can beat the system, there will always be doubts and questions. And if information like this doesn't get out there, it will be even worse -- people will see him as the "doper that got away with it". Whether this information is widely reported will depend on which story the editors deem to be the most marketable - the doper that got away with it, or the anti-doping agency run amuck.
Perhaps the most important point to make is this -- if WADA had better testing procedures, we would never have found ourselves in this position. Floyd Landis would still be a hero. Cycling might still be seen as something besides a circus. And anti-doping might still be trusted. The bad science of WADA has tarnished everything it has touched, including itself.

[This image was also extracted from the presentation. It's on the final page, under the title "Acknowledgements".]
|
|
|
Send Me Email |