gzipped tar file of low- and high-resolution figures (2 x 16 jpg)
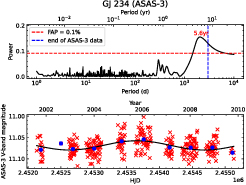
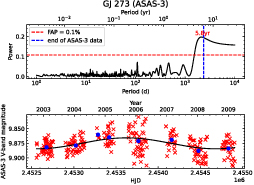
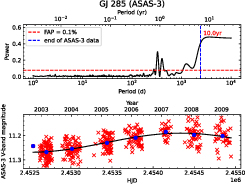
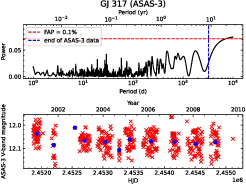
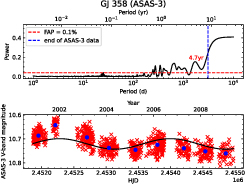
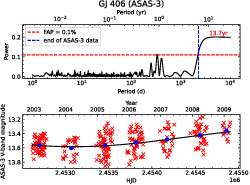
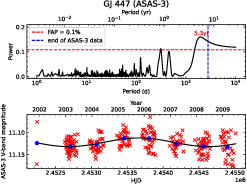
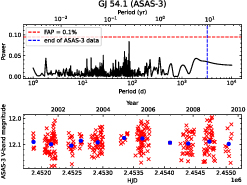
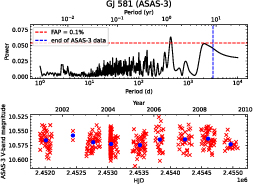
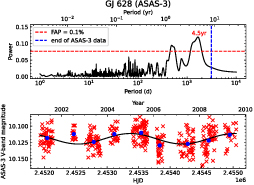
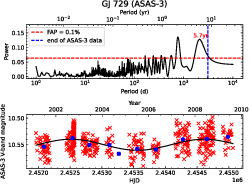
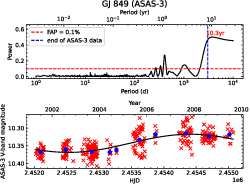
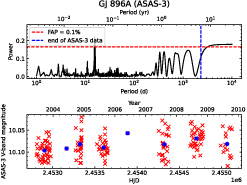
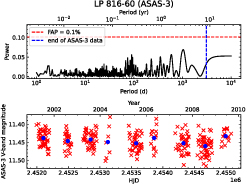
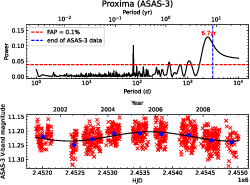
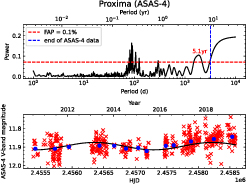
Caption: L-S periodogram (top panels) computed from ASAS-3 data (and also
ASAS-4 for GJ 551/Proxima in the last plot).
The FAP=0.1% threshold is shown by
red dashed lines, and vertical blue dashed lines mark the observational
time spans. In the lower plot of each pair, red X's show observational
data, and blue circles mark the mean values (dates and magnitudes)
for each observing season. The period of the labeled peak in each
periodogram was used to create the sine fits in the lower plots.

| 
| 
| 
| |

| 
| 
| 
| |

| 
| 
| 
| |

| 
| 
| 
|