The first step in any spectral analysis is to extract the photon distribution from both a source and a background region. Any size or shape of region can be specified. The photon distribution can be based on either the pulse height analyzer (PHA) channels or the pulse invariant (PI) bins. To convert the PHA distribution into a PI distribution, the instrument gain must be known. For ROSAT PSPC data, this conversion is done during the on-line (SASS) processing. For IPC observations, the instrument gain varies both across the detector and in time, and is applied during off-line processing (PROS) using the BAL histogram.
By default, spectra are extracted in PI bins for PSPC data and in PHA bins for IPC data.
The background is normalized to the source counts using the ratio of the source-to-background areas. The user has the option to adjust the normalization factor. For IPC data, the background should be obtained within the same field if possible, since the software assumes that the on-source BAL histogram applies to the background region as well.
The errors will be calculated directly from the counts, with the error on the background included. The user has the option of including a systematic error, which is added in quadrature; by default, IPC data has a 3% systematic error included.
Special techniques are required when using Einstein
IPC data. If the
source is a point source, the mirror scattering corrections have been
obtained for a 3 radius circle (or 22.5 pixel). The
corrections will be properly applied only if the source counts are
obtained from a 3
radius circle (or 22.5 pixel). The
corrections will be properly applied only if the source counts are
obtained from a 3 radius circle.
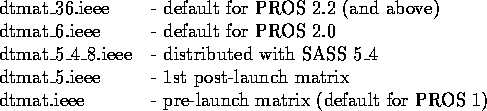
As a consequence of the ongoing inflight calibration effort, there are several versions of the PSPC spectral response matrix available for fitting data in PROS. These are:
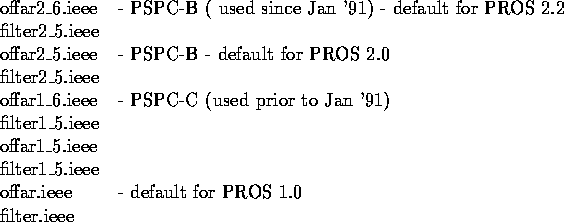
There have also been changes in the filter response and effective area files to accommodate slight differences between the two PSPC detectors (PSPC-C was destroyed Jan 1991). The filter and area files available in PROS are:
Data taken with the boron filter are automatically fitted using the correct area files. Type help pspc_fitting for more information on these calibration files, and how to specify calibration files other that the default ones.
Note that for spectral analysis of off-axis or extended sources, PROS computes an ``off-axis histogram" of the extracted photons, and the fitted model is appropriately corrected for vignetting.
For PSPC data the background spectrum can be corrected for the differential vignetting of the mirror. The charged particle component can also be removed for PSPC data. (Type help pspc_fitting for more details).
Although the PSPC detectors have 256 PI channels, these are binned into 34 channels for both on-line (SASS) and off-line (PROS) spectral analysis. The correspondence between the 256 channels and the 34 channels is given below.
BINNING SCHEMES


    34-bin   Energy    256-channels     34-bin    Energy     256-channels
    number  Low - High   included       number   Low - High    included
    ------ ----- -----  ----------      ------  ----- -----   -----------
      1    0.07 - 0.09     7 - 8          18    0.84 - 0.91    84 - 90
      2    0.09 - 0.11     9 - 10         19    0.91 - 0.99    91 - 98
      3    0.11 - 0.14    11 - 13         20    0.99 - 1.07    99 - 106
      4    0.14 - 0.17    14 - 16         21    1.07 - 1.15   107 - 114
      5    0.17 - 0.20    17 - 19         22    1.15 - 1.23   115 - 122
      6    0.20 - 0.24    20 - 23         23    1.23 - 1.32   123 - 131
      7    0.24 - 0.28    24 - 27         24    1.32 - 1.41   132 - 140
      8    0.28 - 0.32    28 - 31         25    1.41 - 1.50   141 - 149
      9    0.32 - 0.37    32 - 36         26    1.50 - 1.60   150 - 159
     10    0.37 - 0.42    37 - 41         27    1.60 - 1.70   160 - 169
     11    0.42 - 0.47    42 - 46         28    1.70 - 1.80   170 - 179
     12    0.47 - 0.52    47 - 51         29    1.80 - 1.91   180 - 190
     13    0.52 - 0.58    52 - 57         30    1.91 - 2.02   191 - 201
     14    0.58 - 0.64    58 - 63         31    2.02 - 2.13   202 - 212
     15    0.64 - 0.70    64 - 69         32    2.13 - 2.24   213 - 223
     16    0.70 - 0.77    70 - 76         33    2.24 - 2.36   224 - 235
     17    0.77 - 0.84    77 - 83         34    2.36 - 2.48   236 - 247