Archive for the ‘Misc’ Category.
Dec 9th, 2007| 11:55 pm | Posted by hlee
The full article is found from [arXiv/astro-ph:0712.1037]. According to J. P. Dietrich, the positional citation effect (PCE) is significant so that preprints appeared at the top of daily lists tend to be more cited than other preprints. Although the study is not statistically rigorous to confirm that up to 6th article on the list is more likely cited, the number are drastically large enough to make people believe the author’s hypothesis.
Continue reading ‘[ArXiv] The Importance of Being First: Position Dependent Citation Rates on arXiv:astro-ph’ »
Nov 6th, 2007| 05:47 pm | Posted by aneta
The chi2 bias can affect the results of the X-ray spectral fitting and it
can be demonstrated in a simple way. The described simulations can be done
in Sherpa or XSPEC, the two software packages that allow for simulating the X-ray
spectra using a function called “fakeit”.
Here I assume an absorbed power law model with the sets of 3 parameters
(absorption column, photon index, and normalization) to simulate Chandra X-ray
spectrum given the instrument calibration files (RMF/ARF) and the Poisson noise.
The resulting simulated X-ray spectrum contains the model predicted counts with
the Poisson noise. This spectrum is then fit with the absorbed power law model to get
the best fit parameter values for NH, photon index and normalization.
I simulate 1000 spectra and fit each of them using different statistics: chi2 data variance,
chi2 model variance and Cash/C-statistics.
The next step is to plot the simulated distributions of the parameters and compare them
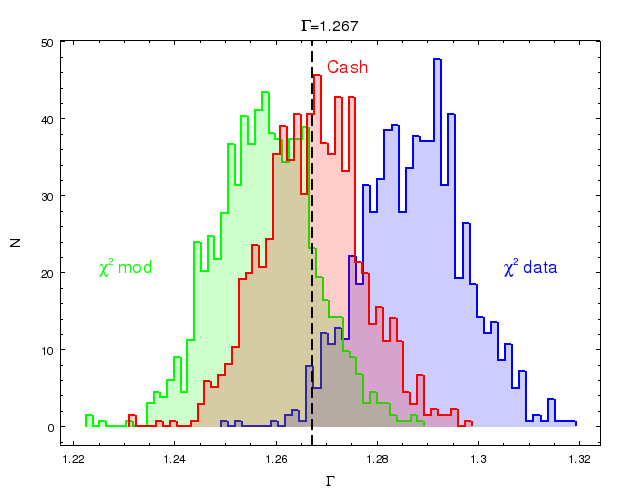
to the assumed values for the simulations. The figure shows the distribution of the photon
index parameter obtain from the fit of the spectra generated for the assumed simulated value
of 1.267. The chi2 bias is evident in this analysis, while the
CSTAT and Cash statistics based on the likelihood behave well. chi2 model variance
underestimates the simulated value, chi2 data variance overestimates this parameter.

The plot shows the distribution of photon index parameters obtained by
fitting the simulated X-ray spectra with about 60000 counts and using the
three different statistics: chi2 with the model variance, chi2 with
data variance and C-statistics (Cash). The assumed value in the
simulations 1.267 is marked with the solid line.
Oct 12th, 2007| 08:04 pm | Posted by aconnors
This is an unusual Quote-of-the-week, in that I point you to [ABSTRACT] and a [VIDEO] of the recent talk at the Institute for Innovative Computing. See what you think! Continue reading ‘Quote of the Week, Oct 12, 2007’ »
Oct 3rd, 2007| 12:09 pm | Posted by aconnors
From the ever-quotable Andrew Gelman comes this gem, which he calls a Folk Theorem :

When things are hard to compute, often the model doesn’t fit the data. Difficulties in computation are therefore often model problems… [When the computation isn't working] we have the duty and freedom to think about models.
Continue reading ‘Quote of the Week, October 3, 2007’ »
Sep 7th, 2007| 11:29 am | Posted by TPark
BEHR (Bayesian Estimation of Hardness Ratios) is a C program designed to compute hardness ratios – summary statistics of a spectrum for faint X-ray sources – while explicitly modeling the arrival of photons as an inhomogeneous Poisson process and properly accounting for background contamination.
In the previous versions of BEHR, users are allowed to choose only the gamma prior distribution that is parametrized in terms of an index (shape) parameter and a scale parameter. But there was need for using a tabulated prior distribution that does not necessarily look like a gamma distribution. The use of a tabulated prior distribution gives us two advantages:
Continue reading ‘BEHR update’ »
Sep 7th, 2007| 01:46 am | Posted by hlee
Ah..Sky in Google Earth made an arxiv appearance [arxiv/astro-ph:0709.0752], Sky in Google Earth: The Next Frontier in Astronomical Data Discovery and Visualization by R. Scranton et al.
Sep 6th, 2007| 08:47 pm | Posted by hlee
I once talked about the relationship between astronomers and statisticians in the slog posting Data Doctors. To astronomers, statisticians are assistants. Statisticians are just helping astronomical data analysis with statistically limited eyes. Less frequently statistical improvements and modification occurred in the astronomical society through collaborations with statisticians compared to other fields.
Continue reading ‘Arrogant?’ »
Aug 13th, 2007| 07:10 pm | Posted by hlee
Aug 6th, 2007| 01:09 pm | Posted by vlk
Much to everybody’s surprise, they let some astronomers into the recently concluded Joint Statistical Meeting at Salt Lake City, UT. There were two three astrostat sessions: [#45 on Probing the Universe with Nonparametric Methods,] #367 on Bayesian Applications in Astronomy and Physics (chaired by David van Dyk), and #411 on Image Analysis in Solar- and Astro-physics (chaired by Yaming Yu and Thomas Lee). Both [of the latter] sessions were dominated by presentations from CHASC collaborators.
Jul 25th, 2007| 01:46 pm | Posted by hlee
From arxiv/astro-ph:0707.3413
The Sixth Data Release of the Sloan Digital Sky Survey by … many people …
The sixth data release of the Sloan Digital Sky Survey (SDSS DR6) is available at http://www.sdss.org/dr6. Additionally, Catalog Archive Service (CAS) and
SQL interface to access the catalog would be useful to data searching statisticians. Simple SQL commends, which are well documented, could narrow down the size of data and the spatial coverage.
Continue reading ‘[ArXiv] SDSS DR6, July 23, 2007’ »
Tags:
catalog,
convex hull peeling,
density estimation,
DR6,
massive data,
multivariate analysis,
nonparametric,
SDSS,
SQL,
voronoi tessellation Category:
Algorithms,
arXiv,
Astro,
Data Processing,
Misc,
Optical |
1 Comment
Jul 18th, 2007| 01:04 am | Posted by hlee
From arxiv/astro-ph:0707.2474,
Visualization, Exploration and Data Analysis of Complex Astrophysical Data by Comparato, Becciani, Costa, Larsson, Garilli, Gheller, and Taylor
This paper introduces a novel advanced visualization tool VisIVO,[] its advantages from combining a protocol called PLASTIC (Platform for Astronomy Tool Interconnection) for displaying and extracting information from astrophysical data, its enhanced connection to VO (Virtual Observatory), and its usage in several scientific cases. Continue reading ‘[ArXiv] Data Visualization, July 17, 2007’ »
Jul 12th, 2007| 03:37 pm | Posted by aconnors
 This is from the very interesting Ingrid Daubechies interview by Dorian Devins,
www.nasonline.org/interviews_daubechies, National Academy of Sciences, U.S.A., 2004. It is from part 6, where Ingrid Daubechies speaks of her early mathematics paper on wavelets. She tries to put the impact into context:
I really explained in the paper where things came from. Because, well, the mathematicians wouldn’t have known. I mean, to them this would have been a question that really came out of nowhere. So, I had to explain it …
I was very happy with [the paper]; I had no inkling that it would take off like that… [Of course] the wavelets themselves are used. I mean, more than even that. I explained in the paper how I came to that. I explained both [a] mathematicians way of looking at it and then to some extent the applications way of looking at it. And I think engineers who read that had been emphasizing a lot the use of Fourier transforms. And I had been looking at the spatial domain. It generated a different way of considering this type of construction. I think, that was the major impact. Because then other constructions were made as well. But I looked at it differently. A change of paradigm. Well, paradigm, I never know what that means. A change of … a way of seeing it. A way of paying attention.
Jul 12th, 2007| 12:02 am | Posted by hlee
Since I start reading arxiv/astro-ph abstracts and a few relevant papers about a month ago, so often I see chi-square something as an optimization or statistical inference tool. Chi-square function, chi-square statistics, chi-square goodness-of-fit test are the words that serve different data analysis purposes but under the same prefix. As a newbie to statistics, although I learned chi-square distribution and chi-square test, doing statistics with chi-square are somewhat considered to be obsolete in terms of robust applications to modern data. These are introduced as one of many distributions and statistical tests. Nothing special. However, in astronomy, chi-square becomes the almost only method for statistical data analysis. I wonder how such strong bond between chi-square tactics and astronomer’s keen mind to data analysis has happened?
Continue reading ‘What is so special about chi square in astronomy?’ »
Jul 10th, 2007| 12:20 pm | Posted by hlee
This is the cover article in the science section of New York Times (July 10, 2007) and talks about Digital Access to a Sky Century at Harvard.
*Click the link to see the article. You may need to sign-up for an access but it’s free.
Jan 29th, 2007| 02:19 am | Posted by hlee
The Statistics Jargon for Astronomers has revived (Jan. 2007) but now, it is barely breathing. Effortlessly search engines and Internet encyclopedia provide details on statistical terminologies for astronomers, which cast the largest difficulty on this jargon website. We urge both astronomers and statisticians’ contributions for compiling this lexicon and their discussions on both subjects.