Archive for the ‘Misc’ Category.
Oct 29th, 2008| 12:41 am | Posted by Jaesub
- So, there is a state of matter other than solid, liquid and gas?
= Of course, are you thinking what I am thinking?
- ….
= Yes, it’s time for a jello-shot.
- ….
We cannot deny the arbitrary nature of units we use, but there is also a useful feature: a linkability to other arbitrary units.
Continue reading ‘A confession from a former “keV” junkie (2. Meet Ms. Electron)’ »
Oct 27th, 2008| 11:05 am | Posted by hlee
The first step of data analysis or applications is reading the data sets into a tool of choice. Recent years, I’ve been using R (see also Learning R) for that regard but I’ve enjoyed freedoms for the same purpose from these languages and tools: BASIC, fortran77/90/95, C/C++, IDL, IRAF, AIPS, mongo/supermongo, MATLAB, Maple, Mathematica, SAS, SPSS, Gauss, ARC, Minitab, and recently Python and ciao which I just began to learn. Many of them I lost the fluency of how to use it. Quick learning tends to be flash memory. Some will need brain defragmentation and recovering time for extensive scientific work. A few I don’t like to use at all. No matter what, I’m not a computer geek. I’m not good at new gadgets, new softwares, nor welcome new and allegedly versatile computing systems. But one must be if he/she want to handle data. Until recently I believed R has such versatility in the aspect of reading in data. Yet, there is nothing without exceptions. Continue reading ‘read.table()’ »
Oct 18th, 2008| 11:27 pm | Posted by vlk
The iPhone is an amazing device. I have heard that some people use it as a phone, too, but it really is an extraordinary portable computer. It is faster and more powerful than the Sparcstations I used as a grad student, and will fit into your pocket. And most importantly, you can fit an entire planetarium on it.
There are many good planetarium programs that you can access on laptops, but it is really not that much fun to lug them around on camping trips or even out on to the roof at night. But now, thanks to the iPhone (and the iPod Touch) there has been a great leap forward. Continue reading ‘Killer App’ »
Tags:
AppStore,
GoSkyWatch,
iAstronomica,
iPhone,
iPod Touch,
iStellar,
planetarium,
review,
Starmap Category:
Astro,
Misc,
News,
Optical |
4 Comments
Oct 10th, 2008| 01:09 pm | Posted by hlee
I do not like to be serious. papers…papers…papers. Off from papers for bridging two, allow me to talk about something relevant to the cultural difference between astronomers and statisticians. I hope this could generate a series of comments.  Continue reading ‘Off the line’ »
Oct 9th, 2008| 11:55 am | Posted by hlee
I bet there are various scams. One of them is automatic user registration. This blog requires a registration for contributing free of approval comments unless one does not put many web links. Recently, there were frequent anonymous user registrations. What I mean by anonymous is that I don’t see their names or part of identities (for example, someone uses initials of their names in their email accounts or uses email accounts from their affiliations). This slog is open to anyone who is interested in AstroStatistics, although not many are currently active. Upon your request, this can be changed very simply and you immediately start writing your ideas about AstroStatistics. However, I must restrict those scams from now on. Please, provide me a small information about you if you do not want to be eliminated after your registration. As I mentioned, the information does not require your full name, nor email account of academic institution. When you register, use your email account that you use daily bases, not the ones that look like results from phishing.
Oct 1st, 2008| 04:16 pm | Posted by hlee
People of experience would say very differently and wisely against what I’m going to discuss now. This post only combines two small cross sections of each branch of two trees, astronomy and statistics. Continue reading ‘survey and design of experiments’ »
Tags:
213,
AAS,
Alanna Connors,
catalog,
census,
detection,
experimental design,
Long Beach,
special session,
SPS,
survey Category:
Astro,
CHASC,
Cross-Cultural,
Data Processing,
Jargon,
Methods,
Misc,
News,
Stat |
3 Comments
Sep 30th, 2008| 01:45 am | Posted by hlee
At least two images for reconstructing a 3D scene is a conventional belief. Yet, we do know that our eyes reconstruct 3D scenes from various single snap shot images, just with one picture. Based on our perception and learning ability or our internal pattern recognition ability, a few groups of people have been trying to reconstruct a 3D image from one still image picture. Luckily you can test such progress, reconstructing a 3D scene from a single still image at Make3D (a click brings you to Make3D at Stanford). Continue reading ‘Make3D’ »
Sep 29th, 2008| 01:43 am | Posted by vlk
The absolutely phenomenal webcomic XKCD hits a home run again, this time sketching out the spatial structure of the Universe all the way from here to The Edge .. in log scale. Continue reading ‘There and back again’ »
Sep 2nd, 2008| 08:13 pm | Posted by hlee
The whole story can be found from the page 8 of IMS Bulletin, Vol.37 Issue 7. (click for the pdf file) Continue reading ‘Irksome’ »
Jul 14th, 2008| 11:55 pm | Posted by vlk
Hyunsook recently said that she wished that there were “some astronomical data depositories where no data reduction is required but one can apply various statistical analyses to the data in the depository to learn and compare statistical methods”. With the caveat that there really is no such thing (every dataset will require case specific reduction; standard processing and reduction are inadequate in all but the simplest of cases), here is a brief list: Continue reading ‘Reduced and Processed Data’ »
Tags:
ADC,
astro catalogs,
Cast,
CDF-S,
Chandra,
datasets,
HEASARC,
Penn State,
reduced,
standard processing,
W3Browse Category:
Astro,
Data Processing,
Misc |
4 Comments
Jun 30th, 2008| 11:12 pm | Posted by hlee
Jun 30th, 2008| 08:50 pm | Posted by aneta
I just saw this web site with the probability plots on the probability papers. Is this real? Does somebody use this type of analysis when everything is done on the computers?
Quote from the web page:
“… probability plotting involves a physical plot of the data on specially constructed probability plotting paper. This method is easily implemented by hand, given that one can obtain the appropriate probability plotting paper.”
http://www.weibull.com/LifeDataWeb/probability_plotting.htm
Jun 21st, 2008| 11:50 pm | Posted by hlee
Now it’s time for me to write my own astrostat papers instead of spending time for sieving them from [arXiv]. It has been an irresistible temptation scanning daily [arXiv] preprints to look for astronomy and sometimes statistics papers that 1. adopt statistics, 2. contain statistically challenging problems, 3. could be improved by more rigorous statistical applications, 4. look like abusing statistics, 5. may inspire statisticians by the data sets, or 6. might be useful for astronomers’ advancement in the data analysis. The temptation grew too much to be handled. The amount of papers belong to the above selection criteria seems to grow as my understanding widens. Also the mesh gets loose and starts to show holes. Continue reading ‘Discontinuation of weekly [arXiv] series’ »
Jun 4th, 2008| 01:00 pm | Posted by vlk
X-ray telescopes generally work by reflecting photons at grazing incidence. As you can imagine, even small imperfections in the mirror polishing will show up as huge roadbumps to the incoming photons, and the higher their energy, the easier it is for them to scatter off their prescribed path. So X-ray telescopes tend to have sharp peaks and fat tails compared to the much more well-behaved normal-incidence telescopes, whose PSFs (Point Spread Functions) can be better approximated as Gaussians.
X-ray telescopes usually also have gratings that can be inserted into the light path, so that photons of different energies get dispersed by different angles, and whose actual energies can then be inferred accurately by measuring how far away on the detector they ended up. The accuracy of the inference is usually limited by the width of the PSF. Thus, a major contributor to the LRF (Line Response Function) is the aforementioned scattering.
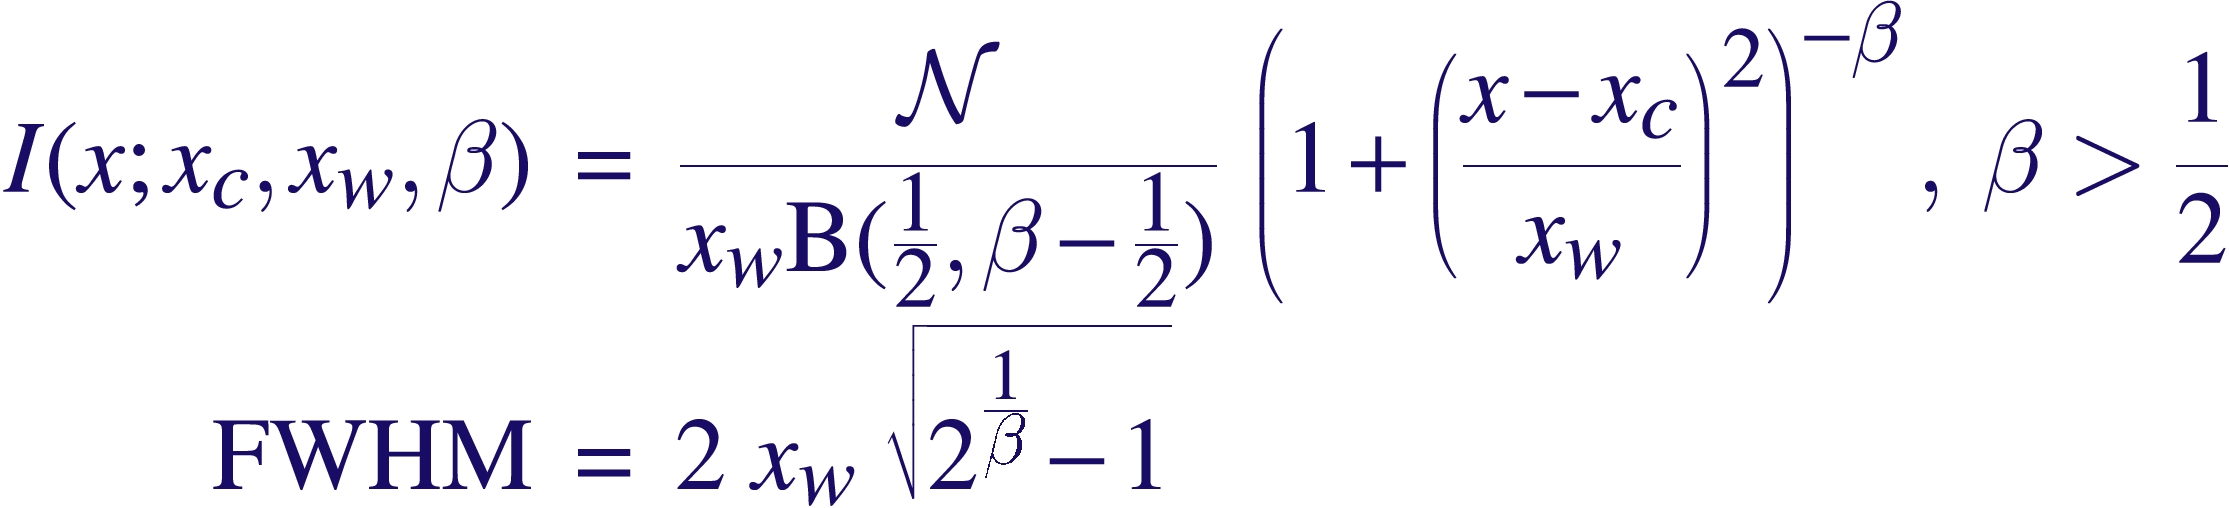
A correct accounting of the spread of photons of course requires a full-fledged response matrix (RMF), but as it turns out, the line profiles can be fairly well approximated with Beta profiles, which are simply Lorentzians modified by taking them to the power β –
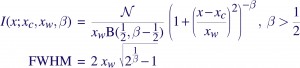
where B(1/2,β-1/2) is the Beta function, and N is a normalization constant defined such that integrating the Beta profile over the real line gives the area under the curve as N. The parameter β controls the sharpness of the function — the higher the β, the peakier it gets, and the more of it that gets pushed into the wings. Chandra LRFs are usually well-modeled with β~2.5, and XMM/RGS appears to require Lorentzians, β~1.
The form of the Lorentzian may also be familiar to people as the Cauchy Distribution, which you get for example when the ratio is taken of two quantities distributed as zero-centered Gaussians. Note that the mean and variance are undefined for that distribution.
Tags:
beta profile,
Chandra,
EotW,
Equation,
Equation of the Week,
Line Response Function,
Lorentzian,
LRF,
point spread function,
PSF,
response matrix,
RMF,
XMM Category:
Astro,
Jargon,
Misc |
1 Comment
May 14th, 2008| 01:00 pm | Posted by vlk
Spectral lines are a ubiquitous feature of astronomical data. This week, we explore the special case of optically thin emission from low-density and high-temperature plasma, and consider the component factors that determine the line intensity. Continue reading ‘Line Emission [EotW]’ »
Tags:
abundance,
emission,
emission measure,
emissivity,
EotW,
Equation,
Equation of the Week,
flux,
ion balance,
line Category:
Astro,
Jargon,
Misc,
Physics,
Stars |
2 Comments