Archive for the ‘X-ray’ Category.
Aug 8th, 2007| 05:14 pm | Posted by hlee
X-ray summer school is on going. Numerous interesting topics were presented but not much about statistics (Only advice so far, “use implemented statistics in x-ray data reduction/analysis tools” and “it’s just a tool”). Nevertheless, I happened to talk two students extensively on their research topics, finding features from light curves. One was very empirical from comparing gamma ray burst trigger time to 24kHz observations and the other was statistical and algorithmic by using Bayesian Block. Sadly, I could not give them answers but the latter one dragged my attention.
Continue reading ‘Change Point Problem’ »
Tags:
ARCH,
Bayesian Block,
challenges,
change point problem,
GARCH,
light curves,
summer school,
X-ray Category:
Algorithms,
Bayesian,
Cross-Cultural,
Data Processing,
gamma-ray,
High-Energy,
Stat,
Timing,
X-ray |
4 Comments
Jul 16th, 2007| 12:15 pm | Posted by hlee
From arxiv/astro-ph:0707.1900v1
The complete catalogue of gamma-ray bursts observed by the Wide Field Cameras on board BeppoSAX by Vetere, et.al.
This paper intend to publicize the largest data set of Gamma Ray Burst (GRB) X-ray afterglows (right curves after the event), which is available from http://www.asdc.asi.it. It is claimed to be a complete on-line catalog of GRB observed by two wide-Field Cameras on board BeppoSAX (Click for its Wiki) in the period of 1996-2002. It is comprised with 77 bursts and 56 GRBs with Xray light curves, covering the energy range 40-700keV. A brief introduction to the instrument, data reduction, and catalog description is given.
Tags:
afterglow,
BeppoSAX,
catalog,
GRB,
light curve Category:
arXiv,
Data Processing,
gamma-ray,
Objects,
Spectral,
Timing,
X-ray |
1 Comment
Jul 11th, 2007| 11:50 am | Posted by vlk
Hyunsook and I have preliminary findings (work done with the help of the X-Atlas group) on the efficacy of using spectral proxies to classify low-mass coronal sources, put up as a poster at the XGratings workshop. The workshop has a “poster haiku” session, where one may summarize a poster in a single transparency and speak on it for a couple of minutes. I cannot count syllables, so I wrote a limerick instead: Continue reading ‘Summarizing Coronal Spectra’ »
Tags:
2007,
dendrograms,
limerick,
PCA,
workshop,
X-Atlas,
XAtlas,
XGratings Category:
Astro,
News,
Quotes,
Spectral,
Stars,
X-ray |
Comment
Jul 5th, 2007| 04:13 pm | Posted by aconnors
 Jeff Scargle (in person [top] and in wavelet transform [bottom], left) weighs in on our continuing discussion on how well “automated fitting”/”Machine Learning” can really work (private communication, June 28, 2007):
It is clearly wrong to say that automated fitting of models to data is impossible. Such a view ignores progress made in the area of machine learning and data mining. Of course there can be problems, I believe mostly connected with two related issues:
* Models that are too fragile (that is, easily broken by unusual data)
* Unusual data (that is, data that lie in some sense outside the arena that one expects)
The antidotes are:
(1) careful study of model sensitivity
(2) if the context warrants, preprocessing to remove “bad” points
(3) lots and lots of trial and error experiments, with both data sets that are as realistic as possible and ones that have extremes (outliers, large errors, errors with unusual properties, etc.)
Trial … error … fix error … retry …
You can quote me on that.

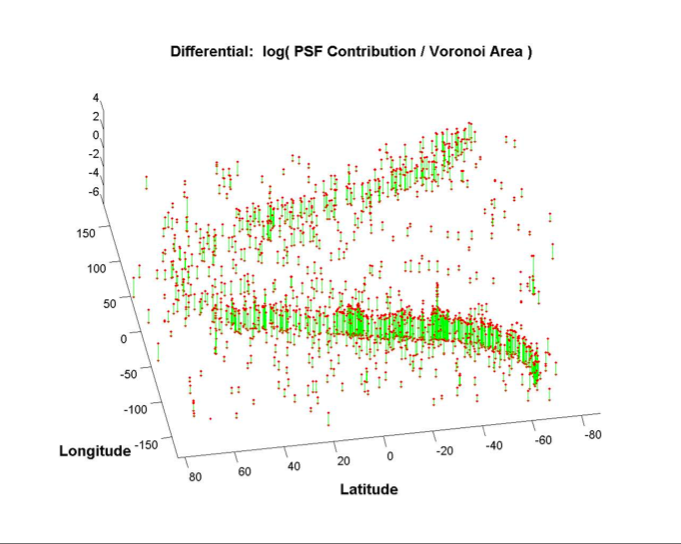
This ilustration is from Jeff Scargle’s First GLAST Symposium (June 2007) talk, pg 14, demonstrating the use of inverse area of Voroni tesselations, weighted by the PSF density, as an automated measure of the density of Poisson Gamma-Ray counts on the sky.
Category:
Algorithms,
Astro,
Data Processing,
gamma-ray,
High-Energy,
Imaging,
Methods,
Quotes,
Stat,
Timing,
X-ray |
1 Comment

