The Flip Test
Why is it that detection of emission lines is more reliable than that of absorption lines?
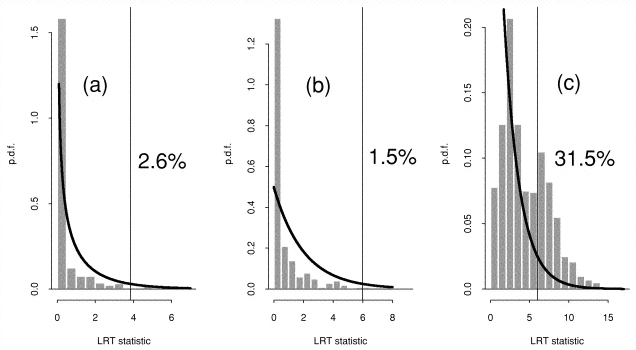
That was one of the questions that came up during the recent AstroStat Special Session at HEAD2008. When you look at the iconic Figure 1 from Protassov et al (2002), which shows how the null distribution of the Likelihood Ratio Test (LRT) and how it holds up for testing the existence of emission and absorption lines. The thin vertical lines are the nominal F-test cutoffs for a 5% false positive rate. The nominal F-test is too conservative in the former case (figures a and b; i.e., actual existing lines will not be recognized as such), and is too anti-conservative in the latter case (figure c; i.e., non-existent lines will be flagged as real).

Why the dichotomy in the two cases? David and Eric basically said during the Q&A that followed their talks that when we know that some statistic is calibrated, we can tell how it is distributed, but when it is not, we usually don’t know how badly off it will be in specific cases.
Here’s an interesting tidbit. A long time ago, in the infancy of my grad studenthood, I learned the following trick. When you are confronted with an emission line spectrum, and you think you see a weak line just barely above noise, how do you avoid getting fooled? You flip the spectrum over and look at it upside down! Does that feature still look like a line? Then you are probably OK with thinking it is real.
But why should that trick work? Our brains seem to be somehow rigged to discount absorption lines, so that when an emission feature is flipped over, it becomes “less significant”. This is the opposite of the usual F-test, and is in fact in line with the method recommended by Protassov et al.
Why this should be so, I have no idea. Will that trick work with trained statisticians? Or even with all astronomers? I have no answers, only questions.
Leave a comment