HRC-S Calibration Data Products
3 February 1999 - FWHM of u- and v-axis projections of the HRMA/HRC-I PSF; revised plate scale6 October 1998 - active area added
21 Sept 1998 - Inclusion of memos on quantum efficiency vs incident angle studies, quantum efficiency uncertainties, HRC-S coordinates, and LETG/HRC-S linearity
1 Sept 1998 - corrections made for dead-time; x-ray effective areas deleted; extended source count rate linearity added; geometry added; qe fine structure added
15 May 1998 - corrections made for dead-time; segment u,v coordinates added
Table of Contents
QE, Gain Maps, etc.HRC-S QE
QE Fine Structure (postscript file)
HRC-S Out-of-Band QE and Effective Area
Spatial Scale
LETG/HRC-S Spatial Linearity
HRC-S Coordinates and Active Area
Count Rate Linearity
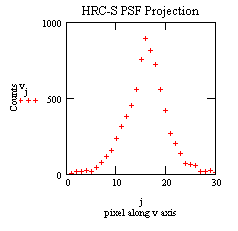
Point Spread Function
Pulse Height Distributions as a Function of Energy
Quantum Efficiency vs Angle of Incidence
References
fits(binary) - qe map
dgp.img(binary) - degapped flat field image (displayed by SAOimage using -u2 flag)
128.dgp.img(binary) - degapped 128 x 128 flat field image (displayed by SAOimage using -u2 flag)
dgp.gmi(binary) - degapped gain map image (displayed by SAOimage using -u2 flag)
prj(ascii) - image projections
pha(ascii) - pulse height distribution
dgp(ascii) - degap parameters
In order to download the files, hold down the "Shift" key and click on the file.
Ascii files may be displayed by merely clicking on them.
The absolute quantum efficiency of the central segment of the HRC-S was measured at eight energies, and each wing segment was measured at four. The XRCF data was not used in this analysis because of the electronic modifications that were made after the XRCF calibrations. A simple model developed by Mike Juda (memo/mathcad-model; in postscript) was used to estimate the detector efficiency between the measured points. A plot of the HRC-S MCP quantum efficiency in zeroth order versus energy is shown in Figure 1. A plot of the HRC-S quantum efficiency (including the UVIS) in zeroth order versus energy is shown in Figure 2.
The transmission of the HRC UV/Ion Shield is well calibrated (to a few percent or better at all energies, even around elemental edges). The quantum efficiency of the CsI coated MCPs is not as well calibrated, however, and extrapolating between the measured points could introduce some model dependent systematic uncertainties. In particular, there are several features of the model that we chose which the user must be cautious of. First, the quantum efficiency above 7 keV is higher than indicated in the model (this should not be significant for HRC-S, however). Second, the jump ratios across the Cs and I M and L edges are too large, so that the model overestimates the efficiency just above the edges. Third, we have not included all the fine structure around the Cs and I M edges. One must be careful in modeling spectra that contain O VIII and Fe XVII lines. All of these issues will be addressed in future iterations of this model.
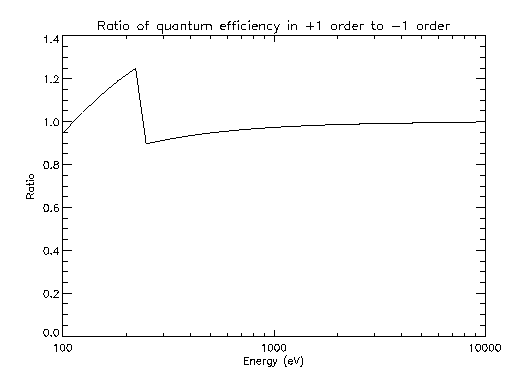
There are two additional detector features that must be included to compute the quantum efficiency curve at the appropriate dispersed location of the +1 and -1 orders of the LETG. These features are the complex structure of the UV/Ion shield and the presence of a gradient in the efficiency across each segment. A schematic diagram of the structure of the HRC-S UVIS is given here. In addition, the quantum efficiency (at a given energy) of each SEGMENT increases with increasing V coordinate. This QE variation is approximately 10% across a given segment, and is seen at all energies. The quantum efficiency at the appropriate dispersed location in the +1 and -1 orders as a function of energy is plotted in Figure 3. The ratio of the quantum efficiency in the two first orders is given in Figure 4. As can be seen from the plots, there are significant (20%) differences in the efficiencies of the +1 and -1 orders at the low energy end of the bandpass.
A discussion of the quantum efficiency measurement uncertainties can be found at http://hea-www.harvard.edu/HRC/calib/qerror2.ps (postscript file)
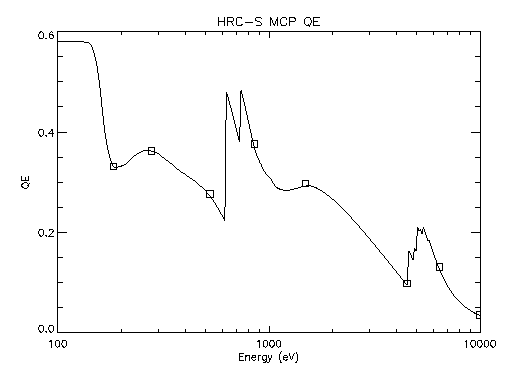
Figure 1. HRC-S zeroth order MCP quantum efficiency.
Table of zeroth order MCP qe.
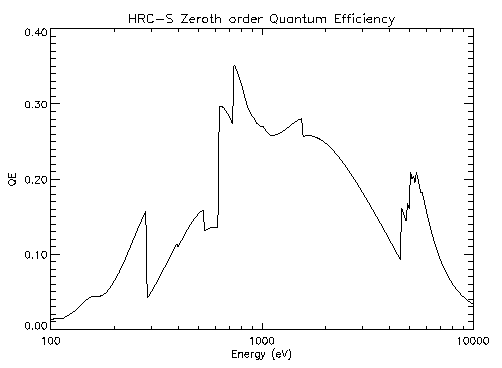
Figure 2. HRC-S zeroth order quantum efficiency (including UVIS).
Table of zeroth order qe.
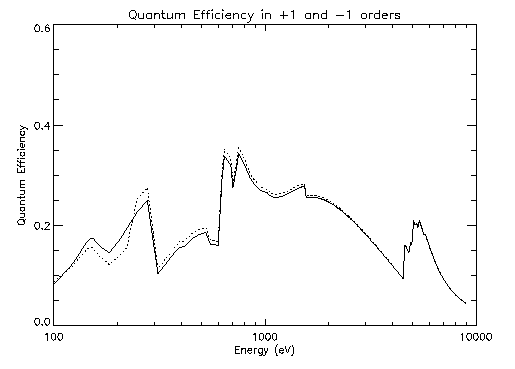
Table of +1 and -1 orders qe.
HRC-S Out-of-Band QE and Effective Area
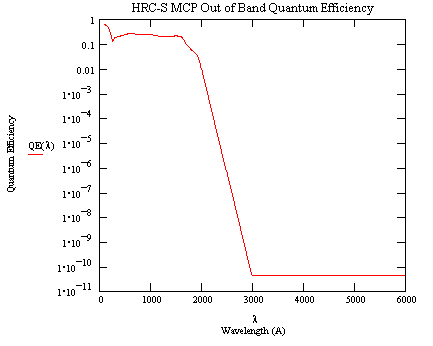
A model of the HRC-S MCP EUV-Visible quantum efficiency. A table of values for the model is provided.
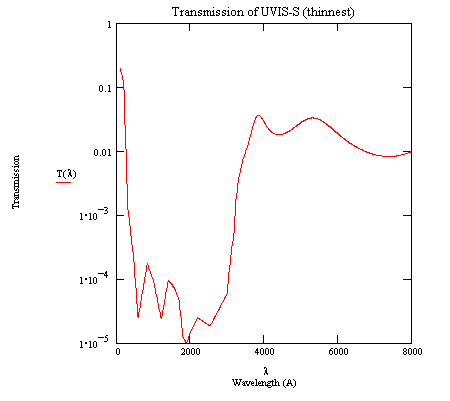
A model of the HRC-S EUV - Visible transmission for segments -1 and +1 under the thin (300 A) aluminum coating. The model is based on a witness sample (TF100-565) measurement (3200-8000A) and linear attenuation coefficients from the literature.
Table hrcso_uvt.prn
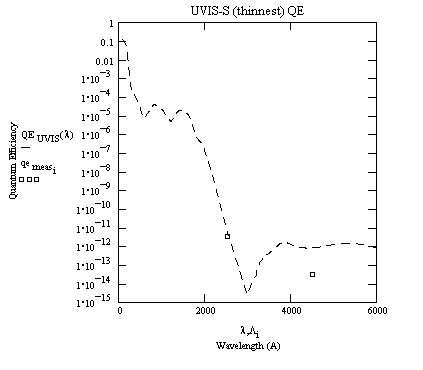
A model of the HRC-S EUV - Visible quantum efficiency for segments -1 and +1 under the thin (300 A) aluminum coating. The boxes are two measurements at 2537 and 4400 A. A table of values for the model is provided.
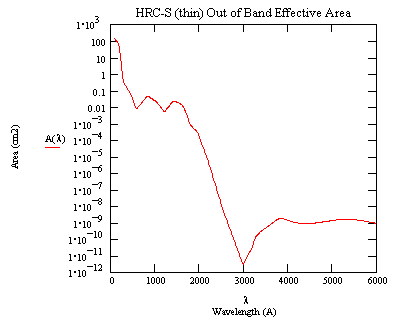
A model of the HRC-S EUV - Visible Effective Area for segments -1 and +1 under the thin (300 A) aluminum coating. A HRMA collecting area of 1100 cm2 has been assumed (constant over the band). A table of values for the model is provided.
V axis: 6.429 microns per pixel
U axis: 6.429 microns per pixel
A memorandum discussing the linearity of the LETG/HRC-S system can be found at http://hea-www.harvard.edu/HRC/calib/letg_analysis.ps (postscript file)
HRC-S Coordinates and Active Area
The active area of the three HRC-S segments is given below:
u dimension: 17.95 mmv dimension:
0 segment - 98.32 mm
+1,0 gap width - 3.91 mm
+1 segment - 98.17 mm
-1, 0 gap width - 4.53 mm
-1 segment - 97.71 mmUncertainty is +/-0.05 mm.
A memorandum discussing the HRC-S coordinate system can be found at http://hea-www.harvard.edu/HRC/calib/hrc-s-coords.ps (postscript file)
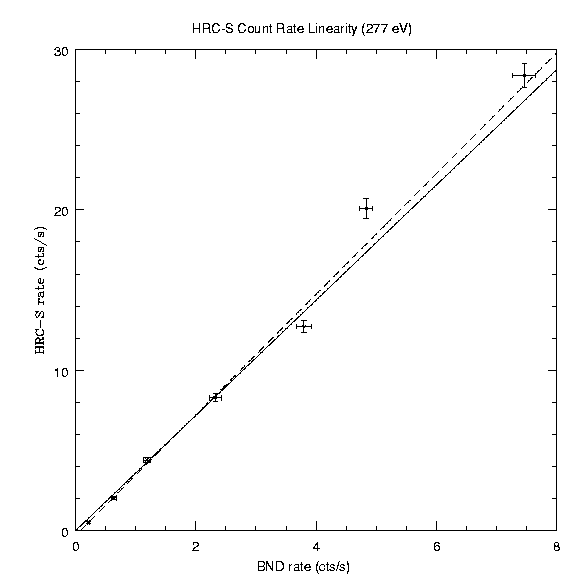
Point source count rate linearity at Carbon K alpha (277 eV). The solid line is the best fit line, if the fit is forced through the origin. The dashed line is the best fit line, if the fit is not forced through the origin. The count rate linearity was determined by measuring the HRC-S rate as a function of the BND-H rate (proportional to the incident flux density).
See also Count Rate Linearity of the AXAF High Resolution Camera (HRC), D. Pease and H. Donnelly (postscript file) or HTML file).
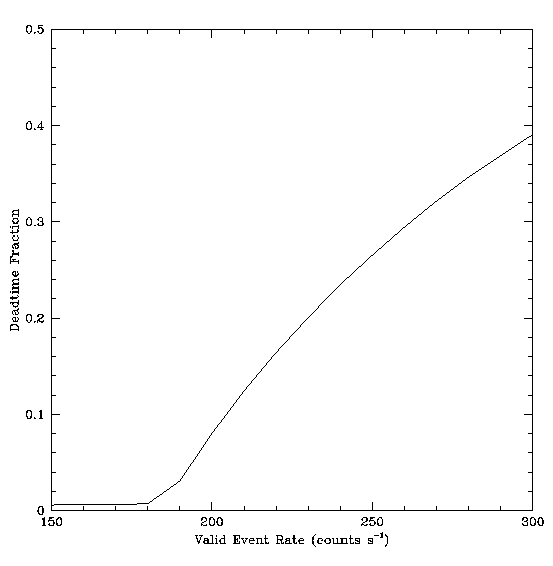
A model of electronic deadtime and telemetry saturation (extended source count rate linearity).
See HRC Deadtime and Telemetry Saturation, M. Juda and A. Dobrzycki (postscript file) for a complete discussion.
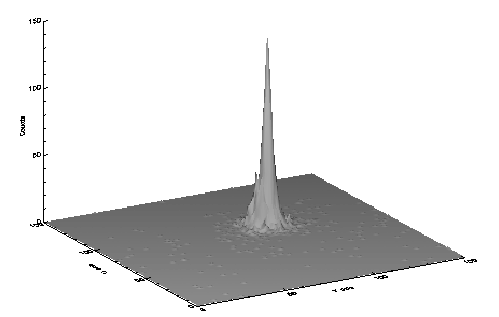
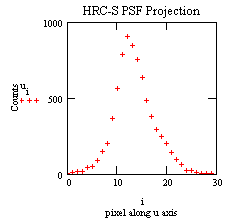
Surface plot of the point spread function of the combined HRC-S and HRMA at Carbon K alpha (277 eV).
Encircled energy versus radius of the HRC-S/HRMA at 277 eV. (postscript file)
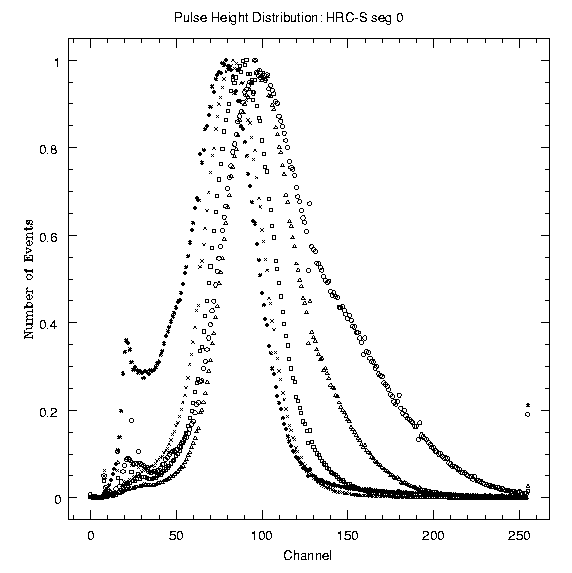
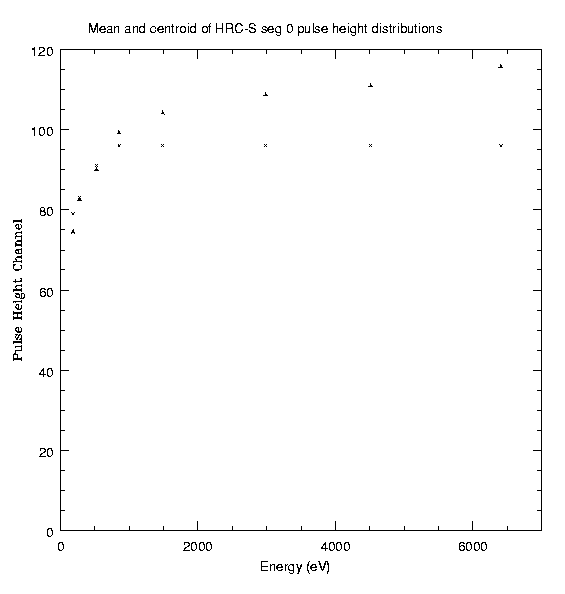
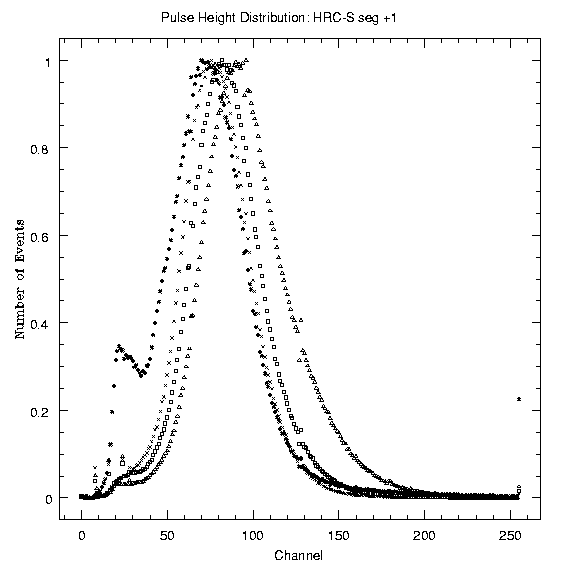
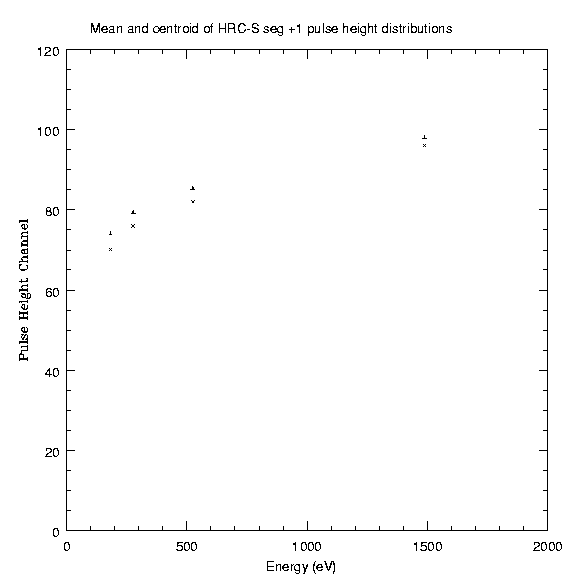
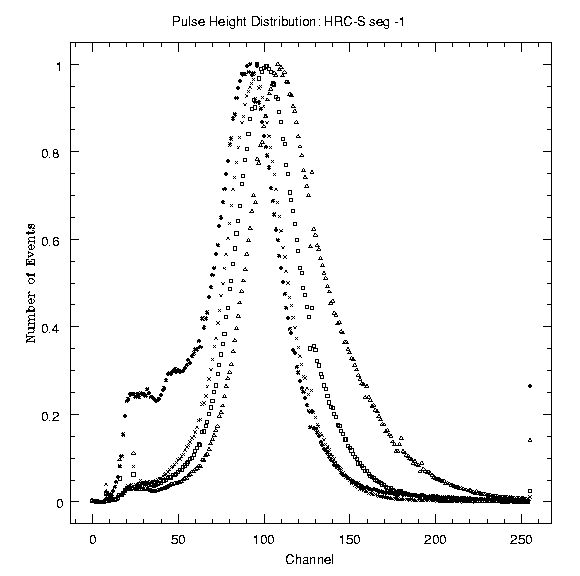
Pulse Height Distributions as a Function of Energy
Plots of the pulse height distributions of the three segments of the HRC-S are given below. Symbol key: B Ka (the asterisk), C Ka (the X), O Ka (the square), Al Ka (the triangle), and Fe Ka (the circle; for segment 0, only). There is considerable variation of both shape and centroid of the PHDs with photon energy in all three segments. A plot of the mean and the centroid of each distribution are also given below. Note the low energy shelf on the B Ka PHDs in all three segments. There is a warm spot on the central segment that accounts for about 25% percent of the counts in this tail. There are, however, no significant warm spots on either of the wing segments. We should point out that these PHDs are averages over an entire segment. These distributions could, in principle, be used to derive some limited (non-dispersive) spectral information.
Quantum Efficiency vs Angle of Incidence
A report of qe vs angle of incidence can be found at http://hea-www.harvard.edu/HRC/calib/pore_ang.ps (postscript file)
A SPIE paper gives details of the measurement procedures, analysis techniques, and results of the XRCF and flat field calibrations.
How to display postscript plots with the Netscape browser.