HRC-I Calibration Data Products
26 April 1999 - Added error bars to spatially averaged qe
1 April 1999 - Added model of HRC-I response to out-of-band radiation
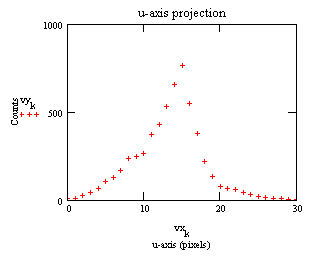
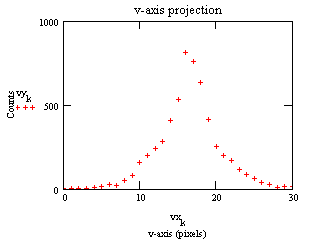
3 February 1999 - FWHM of u- and v-axis projections of the HRMA/HRC-I PSF
6 October 1998 - active area added
21 Sept 1998 - Inclusion of memos on quantum efficiency vs incident angle studies and quantum efficiency uncertainties
3 Sept 1998 - Effective area model deleted; qe model added
1 Sept 1998 - Extended source count rate linearity added; qe fine structure added
13 May 1998 - corrections made for dead-time (see hri_dtc/dtc.ps (postscript file)
Table of Contents
Spatially Averaged QEFlat Field Maps
HRC-I QE
QE Fine Structure (postscript file)
HRC-I Out-of-Band QE and Effective Area
Spatial Scale
Active Area
Count Rate Linearity
Point Spread Function
Pulse Height Distributions as a Function of Energy
Quantum Efficiency vs Angle of Incidence
References
We give here the spatially averaged QE's derived from the SAO HRC laboratory flat field tests for HRC-I.
      E(eV)    QE	% Error
      183     0.063	   12
      277     0.204	    5
      525     0.120	    5
      851     0.281	   10
     1487     0.311	    5
     2980     0.103	   20
     4511     0.110	    7
     6404     0.148	    7
The ratio between corrected and uncorrected (for dead-time) spatially averaged qe's is in dtc_ff_correction.values
Flat Field Maps (64 x 64; in absolute QE)
In order to download the fits files below, hold down the "Shift" key and click on "fits file".
How to display postscript plots with the Netscape browser.
Postscript images show a surface plot, frequency histogram, and u and v projections.
E(eV)
 183  fits file  postscript file
 277  fits file  postscript file
 525  fits file  postscript file
 851  fits file  postscript file
1487  fits file  postscript file
4511  fits file  postscript file
6404  fits file  postscript file
The basic QE model is as outlined in Mike Juda's memo/mathcad-model (in postscript) of 5-20-97 . In short, the model uses primary and secondary electron yield to predict the QE of CsI coated MCPs. The primary and secondary yields depend on the mass absorption coefficients of CsI and the primary and secondary electron ranges. Given a fixed electron range, no linear combination of primary and secondary yields give an adequate fit to the measured HRC-I MCP QE values.
Turning the problem around, the measured QE values can be used to determine an empirical electron range versus energy curve. This electron range curve can then be used to predict electron yield and a therefore a continuous functional form for the HRC-I MCP QE (Figure 1).
This HRC-I MCP QE model was then combined with the transmission model for the UV Ion Shield to produce an HRC-I QE Model(Figure 2).
Post-XRCF flat field quantum efficiencies were determined at only eight energies: 183,277,525,851,1487,2980, 4511 and 6404 eV. One of these flat field QE values (for Ag L) was discarded on account of large uncertainties. Initial attempts to model QE with this minimal set of points produced large and unphysical results. In particular, the predicted QE in the 2 to 4 keV and the 4.5 to 6 keV regions were too high.
Since post-XRCF detector modification raised only the low energy detector response, the QE at some higher energies determined from XRCF effective area measurements was also used as input to the model. This inclusion of XRCF data was deemed appropriate as the effects of the detector modification were minimal for the HRC-I.
A discussion of the quantum efficiency measurement uncertainties can be found at http://hea-www.harvard.edu/HRC/calib/qerror2.ps (postscript file)
The energies and QE values used as input to the model were:
      E(eV)    QE
      183    0.062
      277    0.187
      525    0.109
      851    0.257
     1487    0.282
     2560    0.176
     3500    0.137
     4511    0.100
     5060    0.158
     5660    0.149
     6404    0.135
     9000    0.146
Two XRCF determined QE values (at 5060 eV and 5660) near the Cs and I L edges were scaled by the ratio of flat-field QE to XRCF QE at 4510 eV. The scaling factor was 1.1. This inclusion served to better constrain the model near the Cs and I L edges. The XRCF QE values at 2.56 keV and 3.5 keV were similarly scaled and included.
Discussion:
This procedure has produced a ``pleasing'' model for the HRC-I QE.
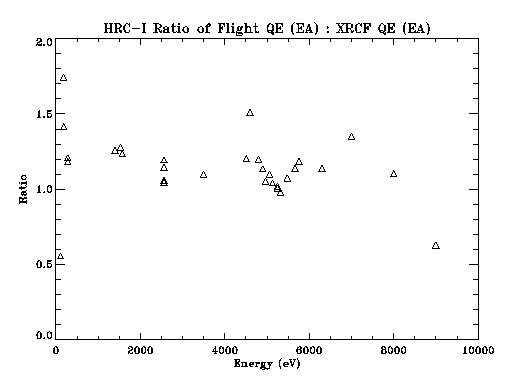
The ratio of model/XRCF QE (Figure 3) reflects what was expected due to hardware changes; The QE at lower energies has been increased and at higher energies the QE is approximately the same. The ratio shows that there is still some discrepancy near the UVIS and the photocathode edges. In addition, the measured quantum efficiency at 9 keV appears too high.
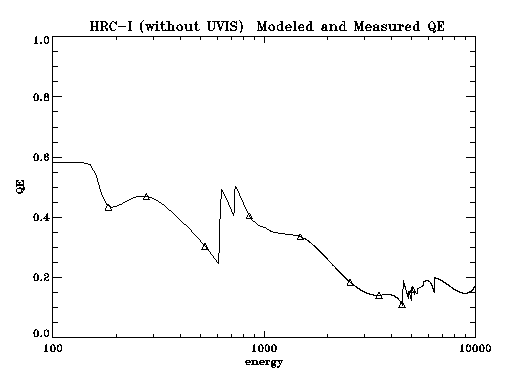
Table of the modeled HRC-I MCP qe.
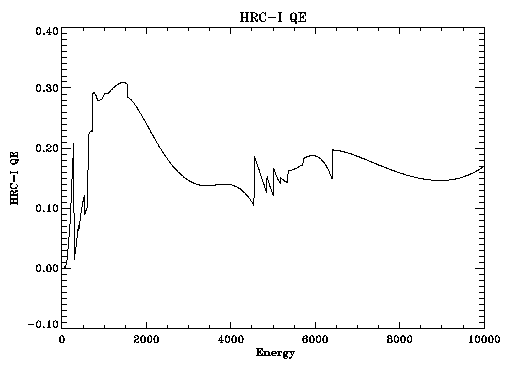
Table of the modeled HRC-I quantum efficiency.
HRC-I Out-of-Band QE and Effective Area
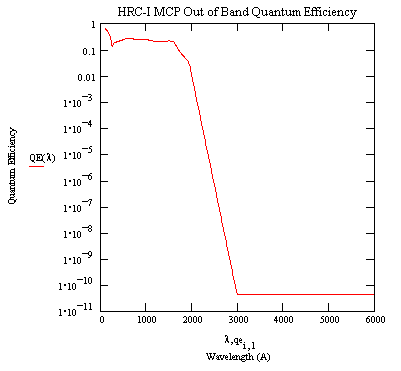
A model of the HRC-I MCP EUV - Visible quantum efficiency. A table of values for the model is provided.
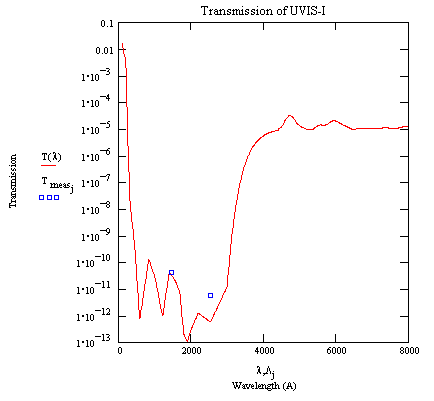
HRC-I UVIS transmission in the EUV - Visible band. The model is based on a witness sample (TF100-1174) measurement (4400-8000 A) and linear attenuation coefficients from the literature. The boxes are two measurements at 1470 and 2537 A.
Table hrci_uvt.prn
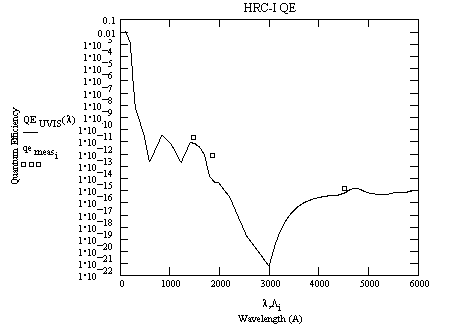
A model of the HRC-I EUV - Visible quantum efficiency. The boxes are two measurements at 1470 and 1850 A and an upper limit at 4400 A
A table of values for the model is provided.
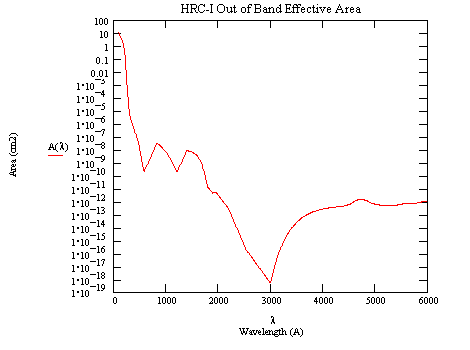
A model of the HRC-I EUV - Visible Effective Area. A HRMA collecting area of 1100 cm2 has been assumed (constant over the band).
A table of values for the model is provided.
A model (in postscript) of the response of HRC-I to out-of-band radiation from stellar sources.
U, V axis: 6.429 microns per pixel
u dimension: 92.56 mmv dimension: 92.77 mm
Uncertainty is +/-0.05 mm.
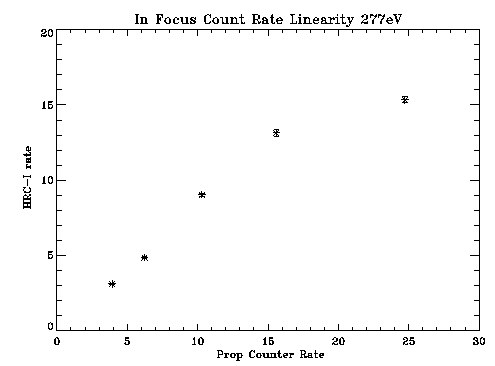
See also Count Rate Linearity of the AXAF High Resolution Camera (HRC), D. Pease and H. Donnelly (postscript file) or HTML file).
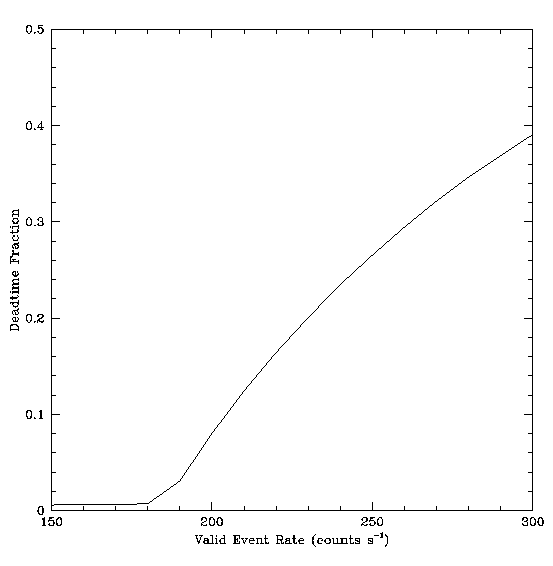
A model of electronic deadtime and telemetry saturation (extended source count rate linearity).
See HRC Deadtime and Telemetry Saturation, M. Juda and A. Dobrzycki (postscript file) for a complete discussion.
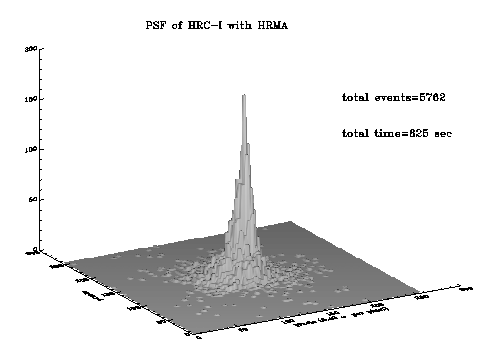
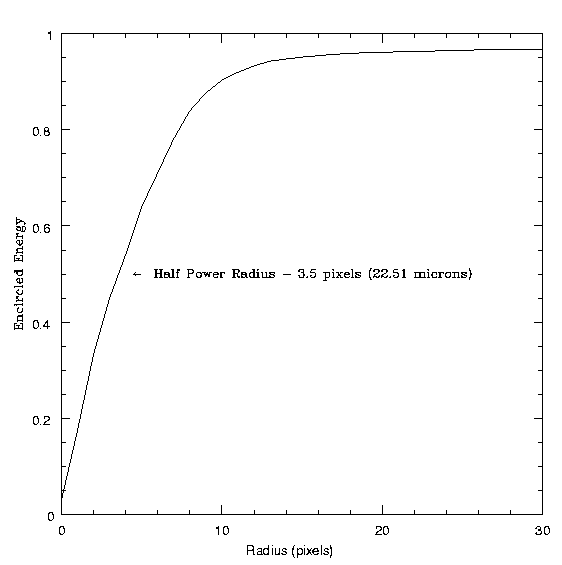
Surface plot of the point spread function of the combined HRC-I and HRMA at Carbon K alpha (277 eV). No FAM motion.
Pulse Height Distributions as a Function of Energy
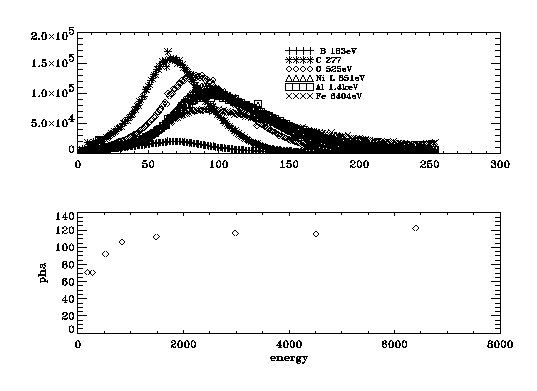
HRC-I pulse height distributions versus energy and the centroids of pulse height versus energy.
Quantum Efficiency vs Angle of Incidence
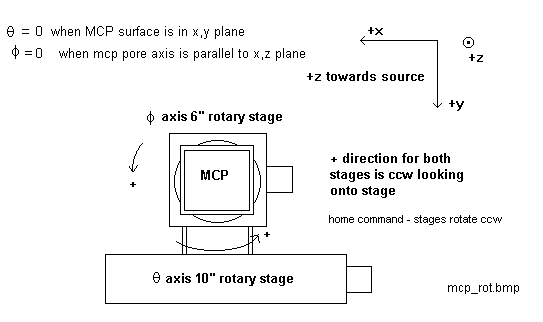
The relative quantum efficiency of a set of MCPs similar to the FM HRC-I MCPs was measured as a function of incident angle for the energy 1.49 keV at two azimuth angles. We have recently extended these measurements in our laboratory to more energies and azimuth angles. A report can be found at http://hea-www.harvard.edu/HRC/calib/pore_ang.ps (postscript file)
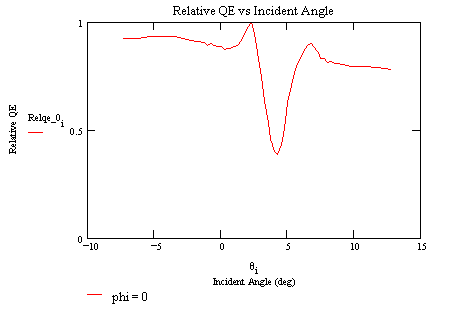
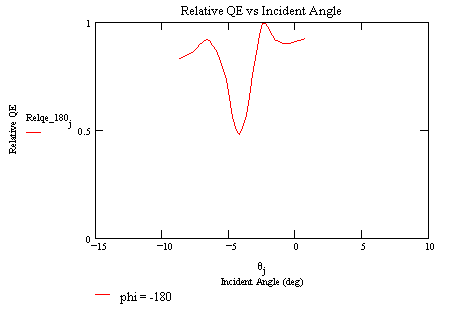
The following diagram defines the angles theta (incident angle) and phi (azimuth angle) for the measurements:
A SPIE paper gives details of the measurement procedures, analysis techniques, and results of the XRCF and flat field calibrations.
How to display postscript plots with the Netscape browser.