Archive for the ‘Imaging’ Category.
Aug 31st, 2007| 11:47 pm | Posted by aconnors
Once again, the middle of a recent (Aug 30-31, 2007) argument within CHASC, on why physicists and astronomers view “3 sigma” results with suspicion and expect (roughly) > 5 sigma; while statisticians and biologists typically assume 95% is OK:
 David van Dyk (representing statistics culture):
Can’t you look at it again? Collect more data?
 Vinay Kashyap (representing astronomy and physics culture):
…I can confidently answer this question: no, alas, we usually cannot look at it again!!
Ah. Hmm. To rephrase [the question]: if you have a “7.5 sigma” feature, with a day-long [imaging Markov Chain Monte Carlo] run you can only show that it is “>3sigma”, but is it possible, even with that day-long run, to tell that the feature is really at 7.5sigma — is that the question? Well that would be nice, but I don’t understand how observing again will help?
 David van Dyk :
No one believes any realistic test is properly calibrated that far into the tail. Using 5-sigma is really just a high bar, but the precise calibration will never be done. (This is a reason not to sweet the computation TOO much.)
Most other scientific areas set the bar lower (2 or 3 sigma) BUT don’t really believe the results unless they are replicated.
My assertion is that I find replicated results more convincing than extreme p-values. And the controversial part: Astronomers should aim for replication rather than worry about 5-sigma.
Jul 12th, 2007| 03:37 pm | Posted by aconnors
 This is from the very interesting Ingrid Daubechies interview by Dorian Devins,
www.nasonline.org/interviews_daubechies, National Academy of Sciences, U.S.A., 2004. It is from part 6, where Ingrid Daubechies speaks of her early mathematics paper on wavelets. She tries to put the impact into context:
I really explained in the paper where things came from. Because, well, the mathematicians wouldn’t have known. I mean, to them this would have been a question that really came out of nowhere. So, I had to explain it …
I was very happy with [the paper]; I had no inkling that it would take off like that… [Of course] the wavelets themselves are used. I mean, more than even that. I explained in the paper how I came to that. I explained both [a] mathematicians way of looking at it and then to some extent the applications way of looking at it. And I think engineers who read that had been emphasizing a lot the use of Fourier transforms. And I had been looking at the spatial domain. It generated a different way of considering this type of construction. I think, that was the major impact. Because then other constructions were made as well. But I looked at it differently. A change of paradigm. Well, paradigm, I never know what that means. A change of … a way of seeing it. A way of paying attention.
Jul 5th, 2007| 04:13 pm | Posted by aconnors
 Jeff Scargle (in person [top] and in wavelet transform [bottom], left) weighs in on our continuing discussion on how well “automated fitting”/”Machine Learning” can really work (private communication, June 28, 2007):
It is clearly wrong to say that automated fitting of models to data is impossible. Such a view ignores progress made in the area of machine learning and data mining. Of course there can be problems, I believe mostly connected with two related issues:
* Models that are too fragile (that is, easily broken by unusual data)
* Unusual data (that is, data that lie in some sense outside the arena that one expects)
The antidotes are:
(1) careful study of model sensitivity
(2) if the context warrants, preprocessing to remove “bad” points
(3) lots and lots of trial and error experiments, with both data sets that are as realistic as possible and ones that have extremes (outliers, large errors, errors with unusual properties, etc.)
Trial … error … fix error … retry …
You can quote me on that.

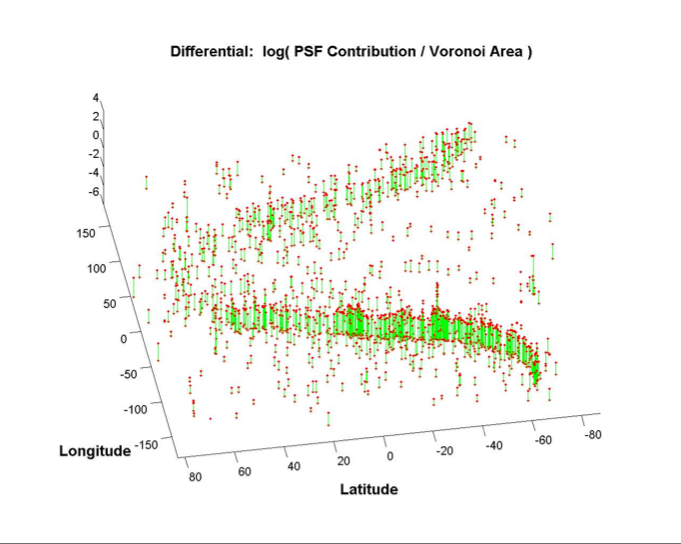
This ilustration is from Jeff Scargle’s First GLAST Symposium (June 2007) talk, pg 14, demonstrating the use of inverse area of Voroni tesselations, weighted by the PSF density, as an automated measure of the density of Poisson Gamma-Ray counts on the sky.
Category:
Algorithms,
Astro,
Data Processing,
gamma-ray,
High-Energy,
Imaging,
Methods,
Quotes,
Stat,
Timing,
X-ray |
1 Comment
May 29th, 2007| 06:12 pm | Posted by aconnors
Marty Weinberg , January 26, 2006, at the opening day of the Source and Feature Detection Working Group of the SAMSI 2006 Special Semester on Astrostatistics :
You can’t think about source detection and feature detection
without thinking of what you are going to use them for. The
ultimate inference problem and source/feature detection need to
go together.
![]() David van Dyk (representing statistics culture):
David van Dyk (representing statistics culture):![]() Vinay Kashyap (representing astronomy and physics culture):
Vinay Kashyap (representing astronomy and physics culture):
