Jun 30th, 2008| 08:50 pm | Posted by aneta
I just saw this web site with the probability plots on the probability papers. Is this real? Does somebody use this type of analysis when everything is done on the computers?
Quote from the web page:
“… probability plotting involves a physical plot of the data on specially constructed probability plotting paper. This method is easily implemented by hand, given that one can obtain the appropriate probability plotting paper.”
http://www.weibull.com/LifeDataWeb/probability_plotting.htm
Apr 17th, 2008| 10:47 pm | Posted by aneta
We have talked about it many times. Now I have to work with the reality. My source shows only 5 counts in a short 5 ksec Chandra exposure. Is this a detection of the source? or is this a random fluctuation? Chandra background is low and data are intrinsically Poisson, so the problem should be easy to solve. Not really! There is no tool to calculate this  well, no actually it is! Tom A. and I found it by searching Google “Python gamma function” and came out with Tom Loredo’s Python functions (sp_funcs.py) that he translated from Numerical Recipes to Python. This is the working tool! We just needed to change “import Numeric” or “import Numarray” to “import numpy as N” and then it worked.
We calculated the significance of observing 5 counts given the expected background counts of 0.1 using spfunc.gammp(5,0.1) =8e-8. The detection is highly significant.
Any comments?
Nov 6th, 2007| 05:47 pm | Posted by aneta
The chi2 bias can affect the results of the X-ray spectral fitting and it
can be demonstrated in a simple way. The described simulations can be done
in Sherpa or XSPEC, the two software packages that allow for simulating the X-ray
spectra using a function called “fakeit”.
Here I assume an absorbed power law model with the sets of 3 parameters
(absorption column, photon index, and normalization) to simulate Chandra X-ray
spectrum given the instrument calibration files (RMF/ARF) and the Poisson noise.
The resulting simulated X-ray spectrum contains the model predicted counts with
the Poisson noise. This spectrum is then fit with the absorbed power law model to get
the best fit parameter values for NH, photon index and normalization.
I simulate 1000 spectra and fit each of them using different statistics: chi2 data variance,
chi2 model variance and Cash/C-statistics.
The next step is to plot the simulated distributions of the parameters and compare them
to the assumed values for the simulations. The figure shows the distribution of the photon
index parameter obtain from the fit of the spectra generated for the assumed simulated value
of 1.267. The chi2 bias is evident in this analysis, while the
CSTAT and Cash statistics based on the likelihood behave well. chi2 model variance
underestimates the simulated value, chi2 data variance overestimates this parameter.
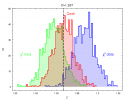
The plot shows the distribution of photon index parameters obtained by
fitting the simulated X-ray spectra with about 60000 counts and using the
three different statistics: chi2 with the model variance, chi2 with
data variance and C-statistics (Cash). The assumed value in the
simulations 1.267 is marked with the solid line.
Oct 3rd, 2007| 06:41 pm | Posted by aneta
I am visiting Copernicus Astronomical Center in Warsaw this week and this is the reason for Polish connection! I learned about two papers that might interest our group. They are authored by Alex Schwarzenberg-Czerny
1. Accuracy of period determination, (1991 MNRAS.253, 198)
Periods of oscillation are frequently found using one of two methods: least-squares (LSQ) fit or power spectrum. Their errors are estimated using the LSQ correlation matrix or the Rayleigh resolution criterion, respectively. In this paper, it is demonstrated that both estimates are statistically incorrect. On the one hand, the LSQ covariance matrix does not account for correlation of residuals from the fit. Neglect of the correlations may cause large underestimation of the variance. On the other hand, the Rayleigh resolution criterion is insensitive to signal-to-noise ratio and thus does not reflect quality of observations. The correct variance estimates are derived for the two methods.
Continue reading ‘Polish AstroStatistics’ »
Sep 6th, 2007| 07:43 am | Posted by aneta
There are two statistics papers on astro-ph. Check them out:
1/ http://arxiv.org/abs/0709.0596
Title: Bayesian Inversion of Stokes Profiles
Authors: A. Asensio Ramos (1), M. J. Martinez Gonzalez (2), J. A. Rubino-Martin (1) ((1) IAC, (2) LERMA)
Comments: 15 pages, 12 figures, accepted for publication in A&A
2/ http://arxiv.org/abs/0709.0711
Title: Bayesian posterior classification of planetary nebulae according to the Peimbert types
Authors: C. Quireza (1), H.J. Rocha-Pinto (2), W.J. Maciel (3) ((1) Observatorio Nacional/MCT, (2) Observatorio do Valongo/UFRJ, (3) Instituto de Astronomia, Geofisica e Ciencias Atmosfericas/USP)
Comments: 26 pages, 4 figures, 6 tables. Accepted for publication in Astronomy and Astrophysics.
